PricePedia Scenario for July 2026
How the geopolitical landscape is shaping commodity price expectations for 2026-2027
Published by Pasquale Marzano. .
Forecast ForecastThe PricePedia Scenario has been updated using information available as of July 2, 2026. The update reflects the easing of tensions between the United States and Iran following the signing of the Memorandum of Understanding on June 18, the ongoing negotiations aimed at reaching a final agreement, and expectations that trade flows through the Strait of Hormuz will return to normal in the near term. As a result, the geopolitical risk premium embedded in commodity markets, and especially in oil prices traded on the major international exchanges, has gradually declined, as discussed in our weekly market update.
The chart below compares financial market expectations for Brent crude oil prices traded on the Intercontinental Exchange (ICE) over the coming months by comparing the futures curve as of July 2, 2026, with that of June 4, 2026, both expressed in US dollars per barrel.
Brent Crude Oil: Comparison of Futures Curves (US Dollars per Barrel)
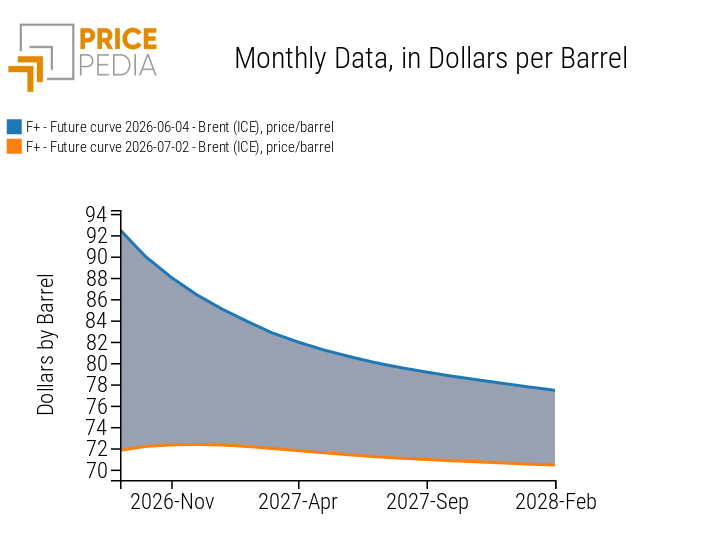
Over the past month, financial market expectations for Brent prices have changed significantly. The July 2 futures curve lies below the June 4 curve across all maturities. For the remainder of 2026, futures prices average below USD 75 per barrel, compared with approximately USD 90 per barrel implied by the early June curve. Expectations have also been revised downward for 2027: the July 2 futures curve points to an average price slightly above USD 71 per barrel, nearly USD 10 lower than the level implied by the June 4 curve for the same period.
The futures curve also points to a gradual recovery in oil prices from current levels over the remainder of 2026. This reflects expectations of stronger oil demand, supported in part by the replenishment of international strategic reserves. During the first weeks of the conflict, the International Energy Agency (IEA) released around 400 million barrels from strategic oil stocks, one of the largest interventions ever undertaken (see CCommodity prices at the mercy of the conflict in the Middle East).
The PricePedia Scenario incorporates this revision in oil market expectations. The average Brent price is now projected to reach just over USD 82 per barrel in 2026, up 21% compared with 2025, before declining by around 10% in 2027.
PricePedia Scenario for July 2026
The evolving geopolitical environment is reshaping the outlook for European physical prices of energy commodities. Under the updated scenario, prices in the energy sector are expected to increase by 8.3% in 2026, roughly half the growth projected in the June 2026 forecast scenario. In 2027, prices are expected to decline by 6.5%, in line with the normalization of trade flows through the Strait of Hormuz.
The improved geopolitical backdrop has also led to a downward revision in the outlook for the overall commodity index. European commodity prices are now expected to rise by 5% in 2026, representing a slower pace of growth than projected in the previous scenario.
The table below reports the annual percentage changes, in euro terms, for the main commodity aggregates included in the PricePedia Forecast Scenario: Industrial Commodities[1], Total Commodities[2], Energy Commodities, and Food Commodities.
Table 1: Annual Growth Rates (%) of PricePedia Aggregate Indices (Euro)
| 2024 | 2025 | 2026 | 2027 | |
|---|---|---|---|---|
| I-Forecast Scenario, 2 July 2026-Commodity Index (Europe) | −4.10 | −4.89 | +4.72 | −2.94 |
| I-Forecast Scenario, 2 July 2026-Energy Total Index (Europe) | −6.18 | −11.66 | +8.31 | −6.52 |
| I-Forecast Scenario, 2 July 2026-Industrials Index (Europe) | −4.62 | −3.15 | +5.96 | +2.30 |
| I-Forecast Scenario, 2 July 2026-Food Total Index (Europe) | +8.83 | +17.10 | −10.37 | −7.70 |
Compared with the previous forecast, the improved geopolitical environment has also led to a downward revision in growth expectations for industrial commodities. Over the 2026-2027 period, prices are now expected to increase by a cumulative 8.3%, down from the 10% projected in the previous scenario.
Within the sector, the strongest price increases are expected for non-ferrous metals, particularly copper and copper alloys, whose prices are projected to rise by more than 25% over the two-year period. This trend is primarily supported by demand linked to the twin digital and energy transitions.
Thermoplastic polymers are also expected to post strong average growth in 2026, reflecting the price increases already recorded following the energy shock triggered by the conflict. Over the coming months, however, prices are expected to trend downward, as discussed in the analysis Effects of the reopening of the Strait of Hormuz on prices in the petrochemical supply chains.
1. The PricePedia Industrials index results from the aggregation of the indices relating to the following product categories: Ferrous, Non-Ferrous, Wood and Paper, Chemicals: Specialty, Organic Chemicals, Inorganic Chemicals, Plastics and Elastomers and Textile Fibres.
2. The PricePedia Commodity index results from the aggregation of the indices relating to industrial, food and energy commodities.
You may be interested in:

PricePedia Scenario for October 2026
Published by Pasquale Marzano. .
Forecast ForecastThe new escalation renews upward pressure on industrial commodity prices [ Read all ]
Crude steel production on the decline: how are forecasts for ferrous metals changing?
Published by Luca Sazzini. .
Ferrous Metals Forecast ForecastThe decline in crude steel production and the escalation in the Middle East are affecting the PricePedia outlook for ferrous metal prices [ Read all ]

PricePedia Scenario for September 2026
Published by Pasquale Marzano. .
Forecast ForecastPurchase material prices amid geopolitical tensions and supply shortages [ Read all ]