Analysis of financial commodity prices amid supply imbalances and tensions
Commodity markets continue to be marked by high uncertainty
Published by Luca Sazzini. .
Conjunctural Indicators Commodities Financial WeekAfter the collapse in financial prices of oil following the official signing of the memorandum of understanding between the United States and Iran, Brent prices subsequently stabilized at around $70/barrel, in line with pre-conflict levels.
The oil market does not appear to incorporate any geopolitical risk premium, pointing to a scenario of a lasting ceasefire and a rapid and sustainable recovery of flows through the Strait of Hormuz. However, several uncertainty factors remain, including Iran’s claim to the right to introduce a toll on ships transiting through Hormuz, in contrast with the US position on freedom of international navigation, and still unresolved issues concerning the nuclear dossier.
Market fundamentals have also changed significantly compared to four months ago: oil supply has fallen sharply and, although supplies are gradually recovering, they still remain far from previous levels.
Prices of petroleum distillates remain significantly above pre-conflict levels, with gasoline and diesel up by almost 50% and 30%, respectively, compared to average prices in February 2026.
The war in the Persian Gulf and the closure of the Strait of Hormuz led the main producing countries to introduce severe restrictions on exports of refined products, causing a significant contraction in global supply.
The picture is further worsened by the risk of a total halt to Russian diesel exports, especially following the recent Ukrainian attacks on the Kapotnya refinery in Moscow.
The European natural gas market recorded a partial weekly price rebound, attributable both to lower inventories and to higher demand linked to increased electricity needs for summer cooling.
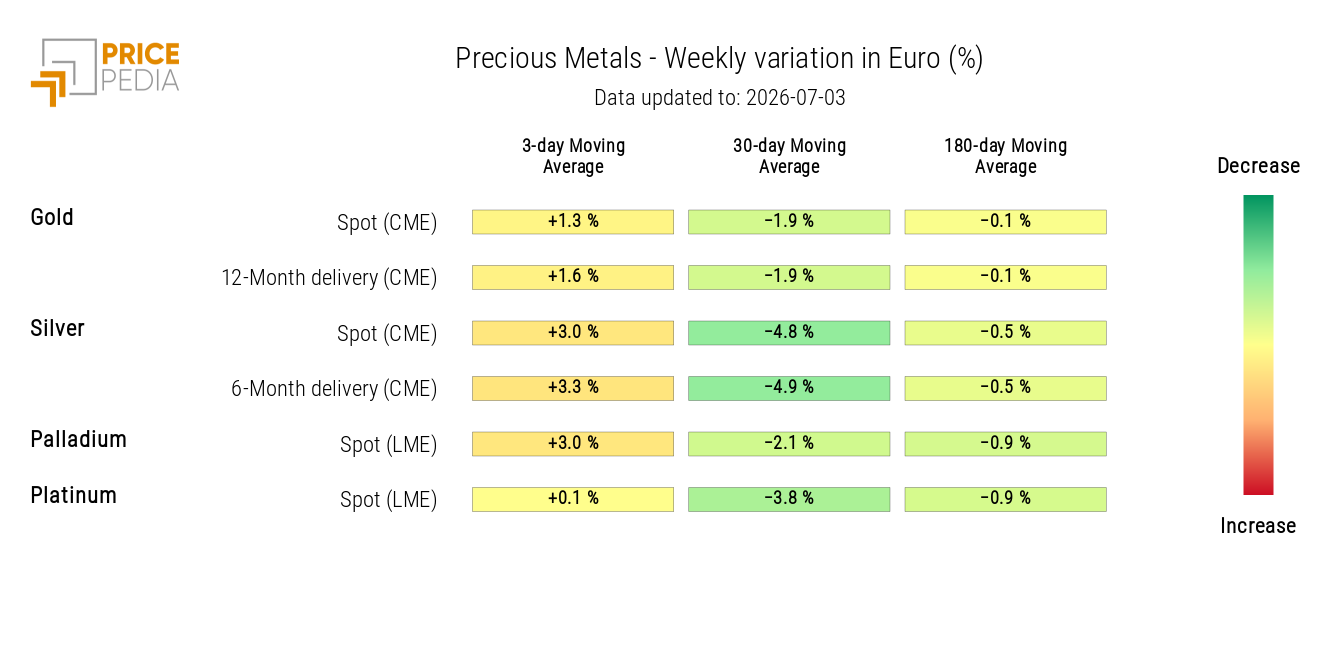
In the precious metals sector, the corrective phase in prices came to a halt, with a slight rebound in the latest sessions. Lower-than-expected growth in European inflation and weaker-than-expected US employment data eased fears of interest rate hikes by central banks, thereby strengthening the appeal of safe-haven assets.
As regards industrial metals, the correction phase continued in both the ferrous and non-ferrous segments.
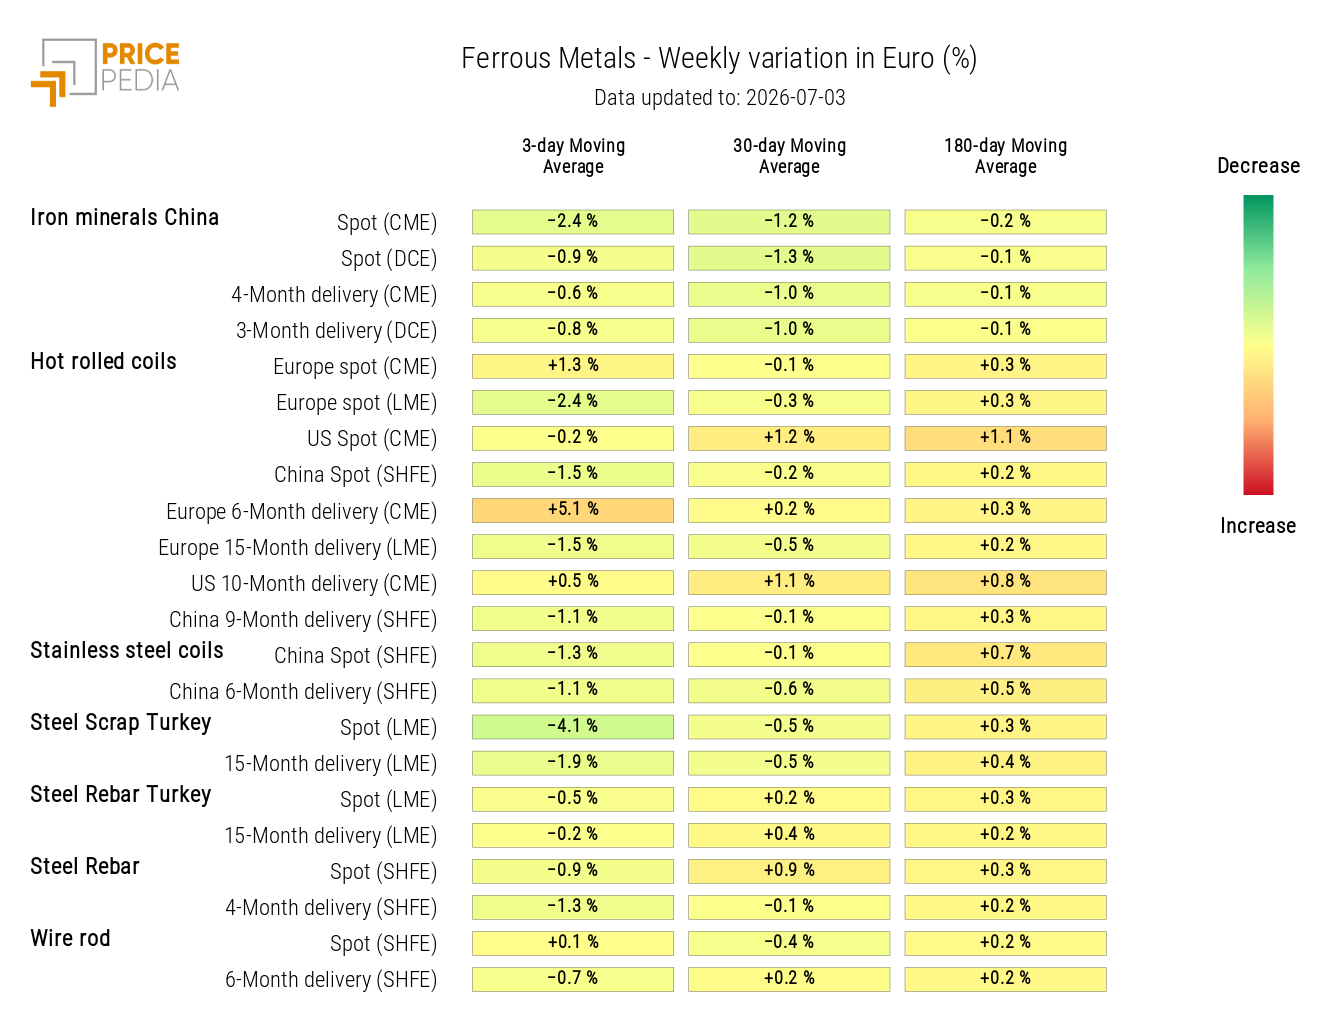
Among the former, declines were recorded for Turkish steel scrap, European hot-rolled coils and iron ore.
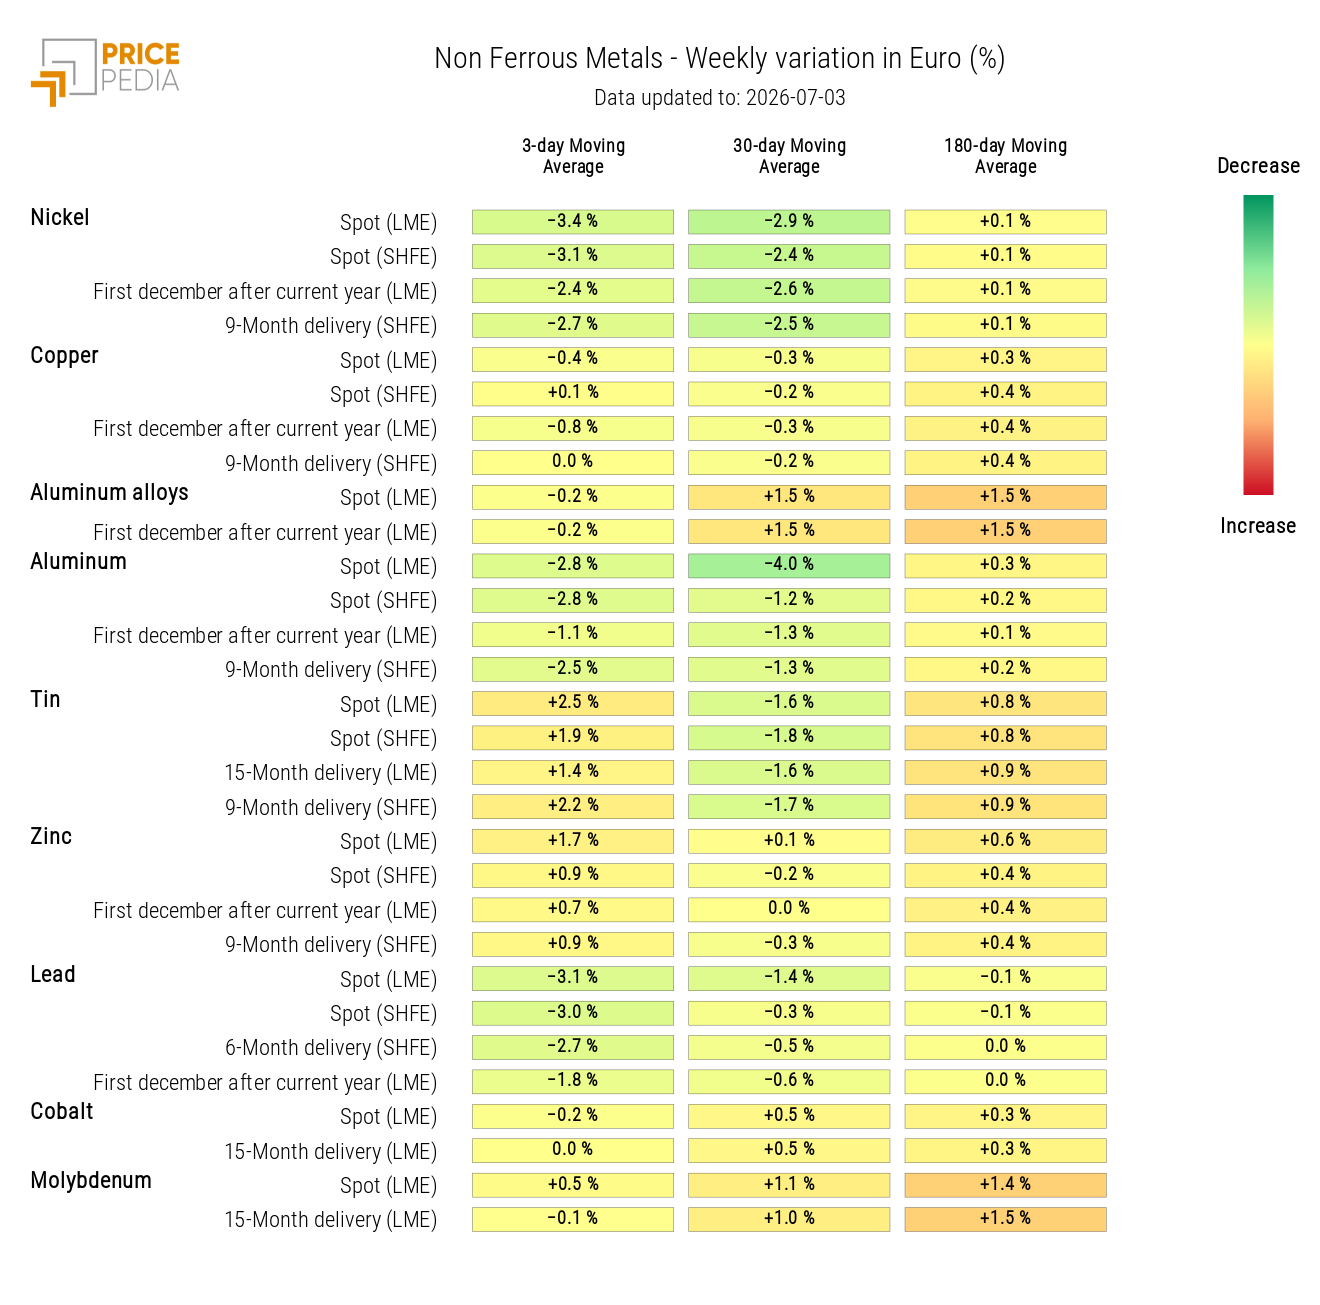
Among non-ferrous metals, the sharpest contraction concerned nickel, penalized by expectations of a possible increase in production quotas in Indonesia, which reduced fears of supply restrictions and a market deficit. Declines were also recorded for aluminum, favored by the reopening of the Strait of Hormuz, and for lead, which is currently characterized by excess supply.
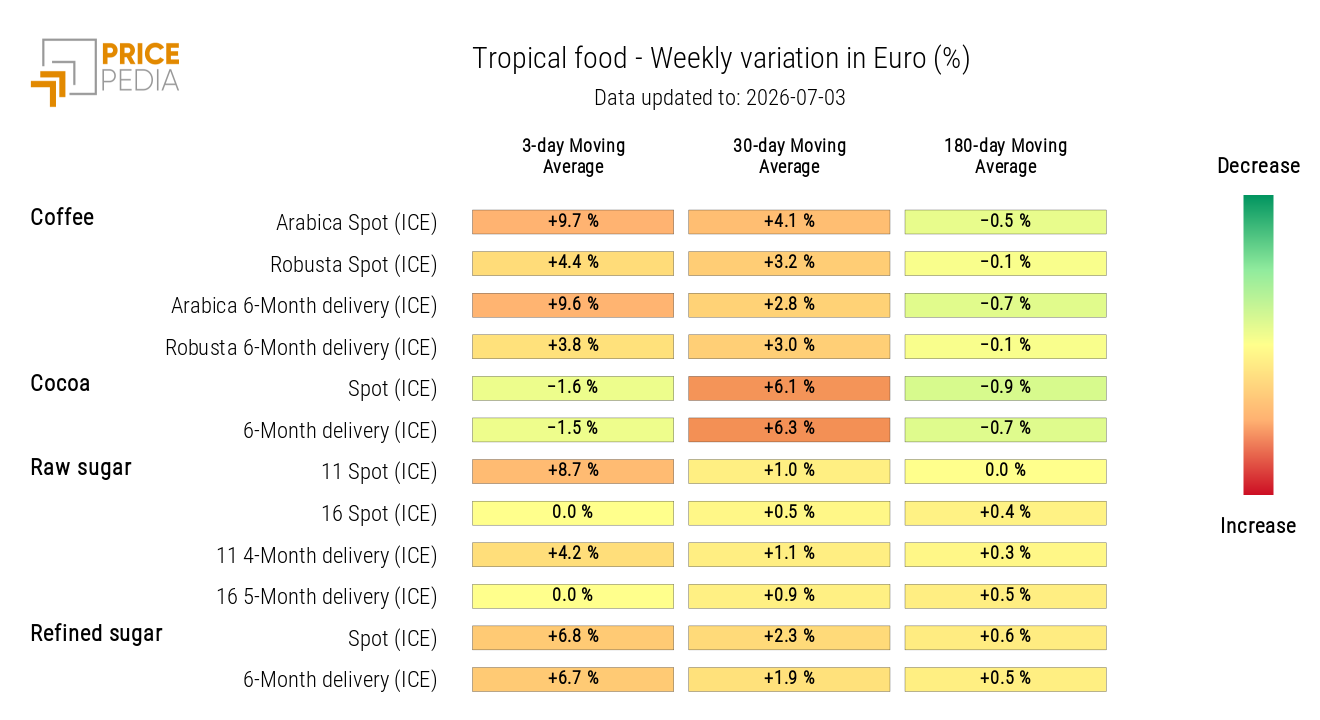
As regards agricultural commodities, prices of tropical products rose, particularly coffee and sugar, supported by expectations of a possible return of the El Niño phenomenon.
NUMERICAL APPENDIX
ENERGY
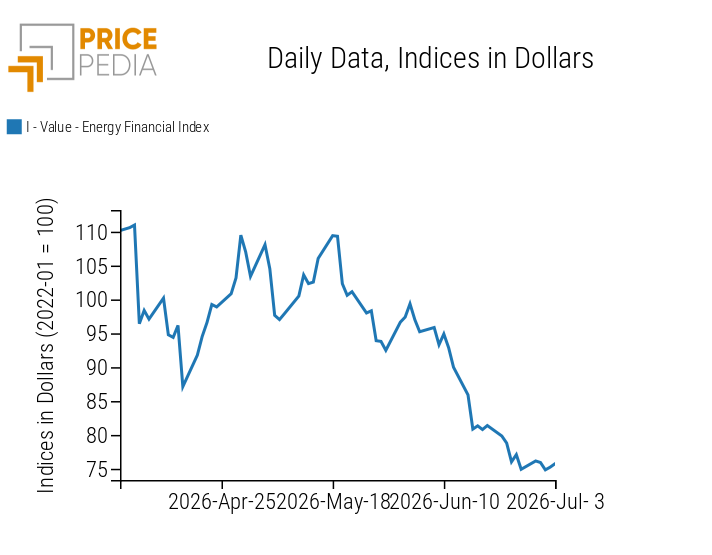
Following the collapse in energy prices linked to the reopening of the Strait of Hormuz, the PricePedia financial index for energy products shows signs of price stabilization.
PricePedia Financial Index of energy prices in dollars
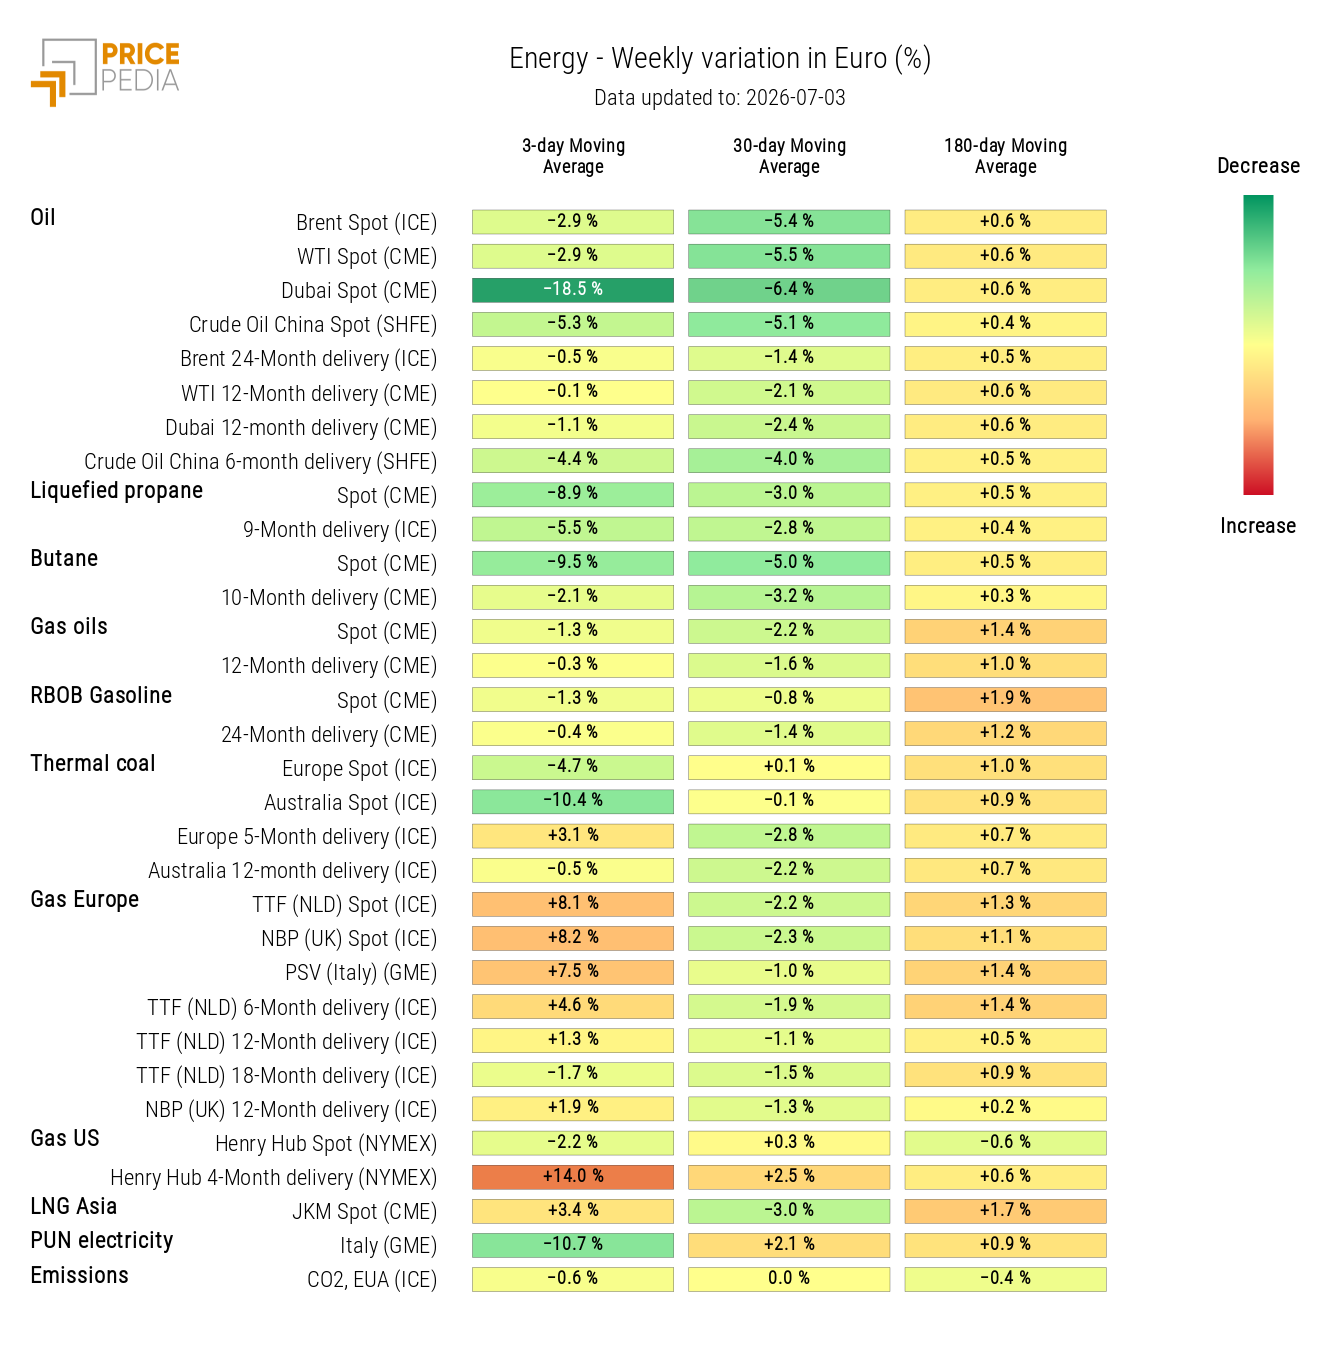
The energy heatmap highlights the sharp fall in prices of petroleum products, against a recovery in natural gas prices.
HeatMap of energy prices in euros
PLASTICS AND ELASTOMERS
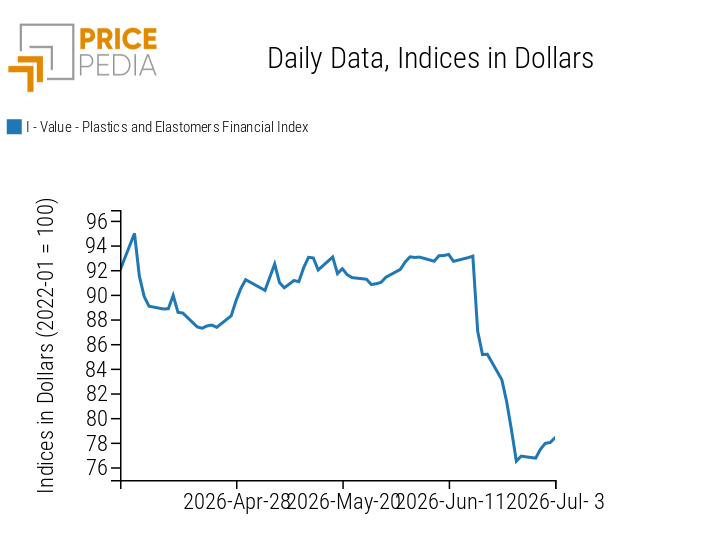
The financial index for plastics and elastomers shows a slight recovery, after the marked decline recorded in the previous week.
PricePedia Financial Index of plastics and elastomers prices in dollars
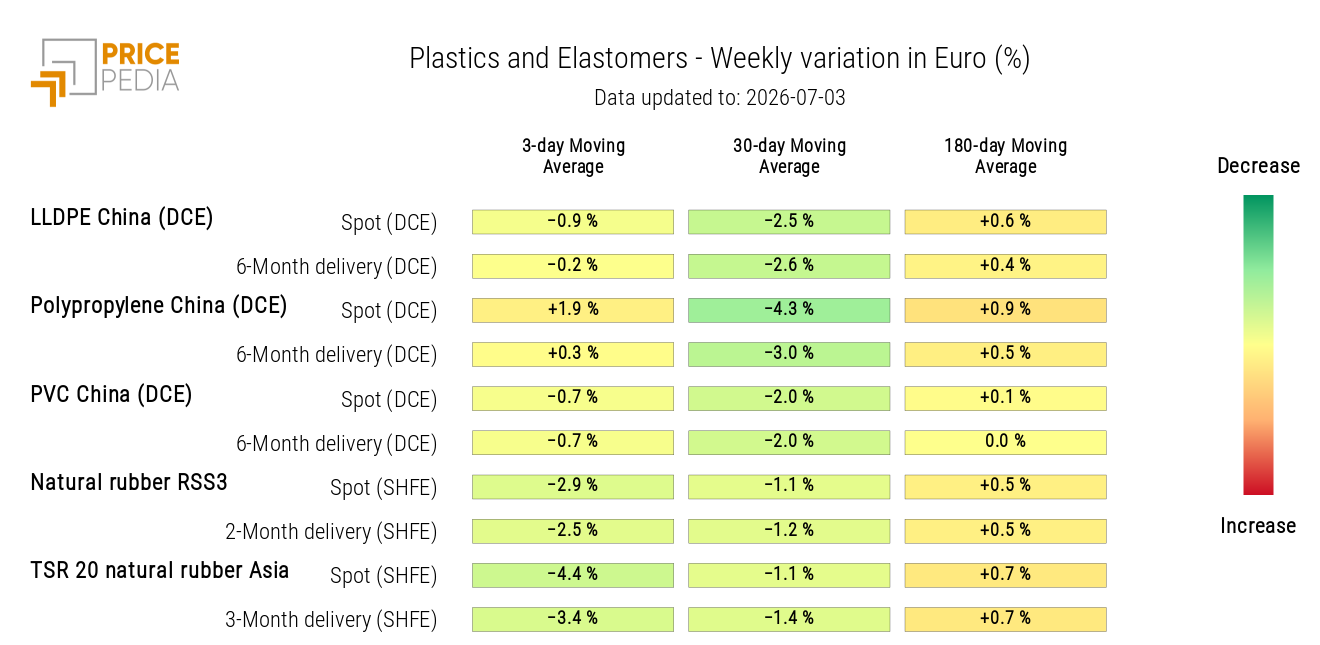
The analysis of the heatmap for thermoplastics and elastomers shows a weekly increase in the 3-day moving average of polypropylene, against a decline in elastomers.
HeatMap of plastics and elastomers prices in euros
PRECIOUS METALS
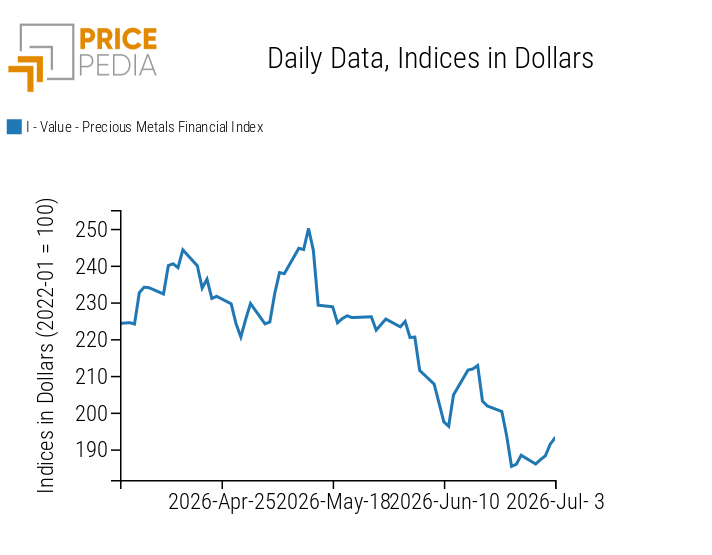
The financial index for precious metals interrupts the price reduction phase following the publication of new data on European inflation and employment in the United States.
PricePedia Financial Index of precious metals prices in dollars
The heatmap analysis shows a partial recovery in financial prices of precious metals, especially silver and palladium.
HeatMap of precious metals prices in euros
FERROUS METALS
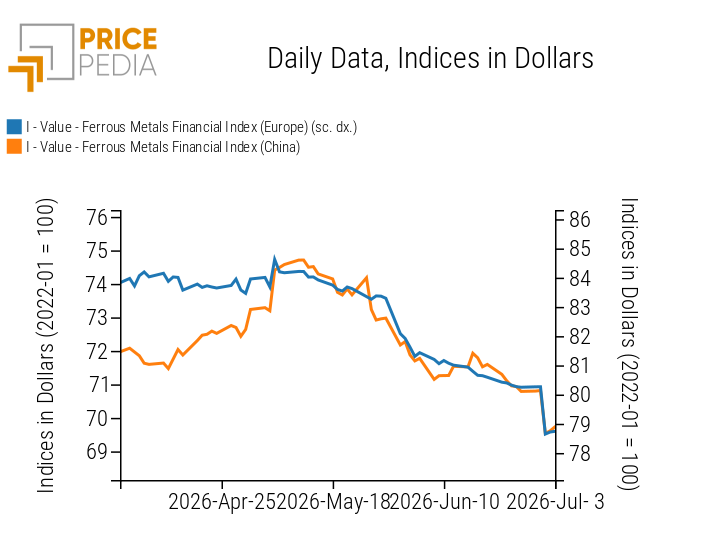
The financial indices for ferrous metals both indicate a downward price trend.
PricePedia Financial Indices of ferrous metal prices in dollars
The heatmap analysis highlights a weekly decline in prices of iron ore, European steel coils and Turkish steel scrap.
HeatMap of ferrous metal prices in euros
Do you want to stay up-to-date on commodity market trends?
Sign up for PricePedia newsletter: it's free!
INDUSTRIAL NON-FERROUS METALS
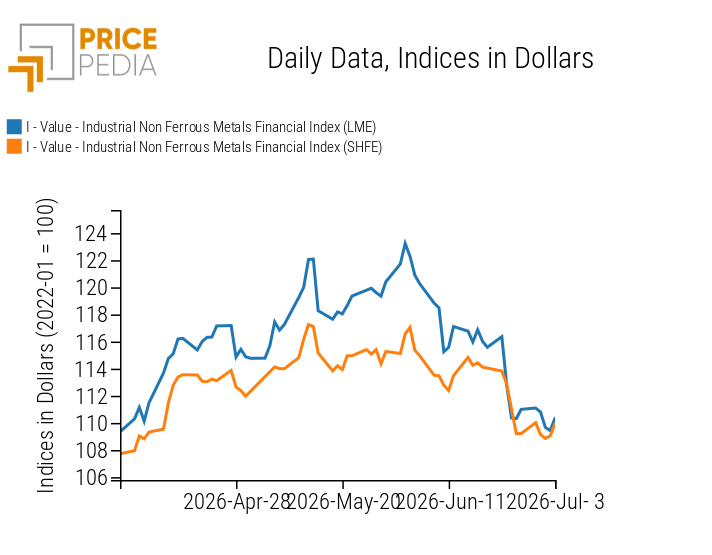
The two non-ferrous metal indices both follow a downward price trend, with a slight recovery towards the end of the week.
PricePedia Financial Indices of industrial non-ferrous metal prices in dollars
The analysis of the non-ferrous metals heatmap shows a weekly decline in nickel, aluminum and lead prices.
HeatMap of non-ferrous metal prices in euros
FOOD COMMODITIES
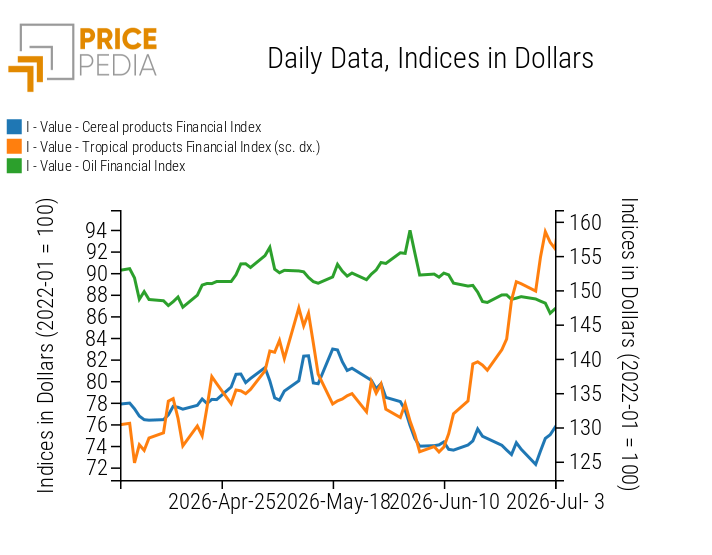
Net of weekly fluctuations, the financial index for tropical commodities continues its growth phase, while those for cereals and oils remain relatively stable on a weekly basis.
PricePedia Financial Indices of food commodity prices in dollars
TROPICAL COMMODITIES
The tropical commodities heatmap highlights the weekly increase in coffee and sugar prices.
HeatMap of tropical food commodity prices in euros
OILS
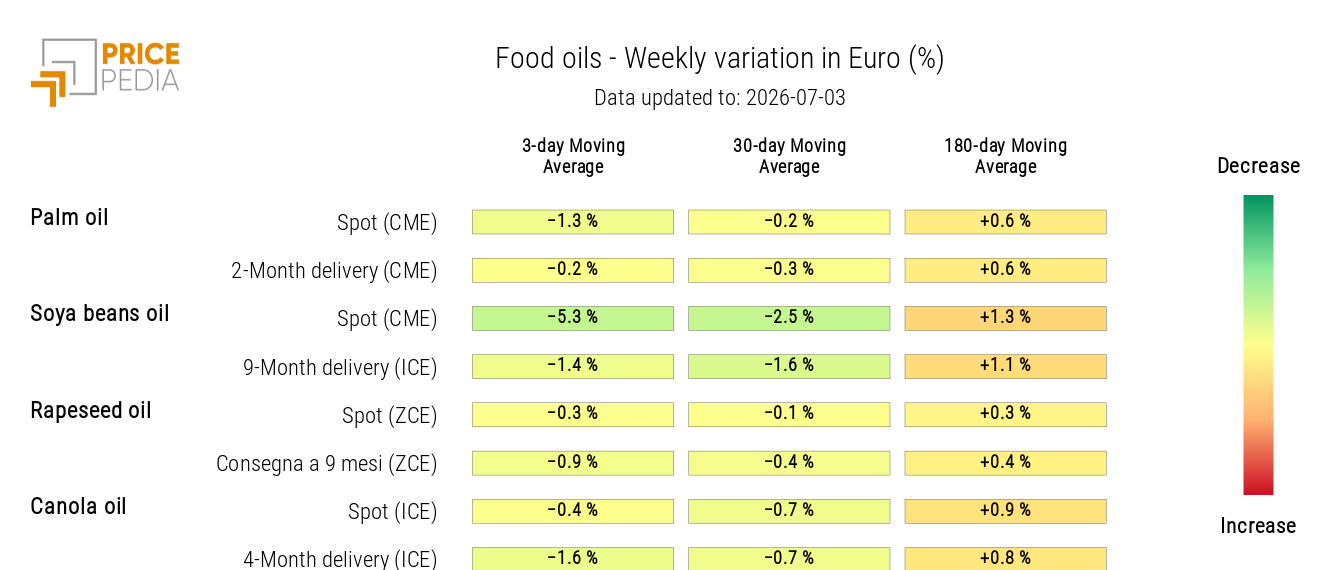
The edible oils heatmap shows a weekly decline in the 3-day moving average of soybean oil prices.
HeatMap of edible oil prices in euros
You may be interested in:

Expectations of tighter monetary policy are weighing on commodity markets
Published by Luca Sazzini. .
Conjunctural Indicators Commodities Financial WeekThe decline in prices is affecting most sectors [ Read all ]

Commodity markets between supply risks and geopolitical uncertainty
Published by Luca Sazzini. .
Conjunctural Indicators Commodities Financial WeekThe strength of the U.S. economy is bolstering expectations of a more restrictive monetary policy [ Read all ]

China economic update August 2026
Published by Luca Sazzini. .
Conjunctural Indicators Global Economic TrendsIncreased competitive pressure is driving down the prices of Chinese commodities [ Read all ]