China economic update September 2026
Industrial commodity prices between rising energy input costs and domestic competitive pressure
Published by Luca Sazzini. .
Conjunctural Indicators Global Economic TrendsAs reported in the latest article on the European economic outlook, in September, escalating tensions in the Middle East increased risks to trade routes through Hormuz and Bab el-Mandeb, fuelling concerns about disruptions to oil supplies and higher logistics costs. Concerns over supply security helped push the monthly average Brent price above $100/barrel, compared with $88/barrel in August.
The increase in energy prices was also reflected in the Chinese market, supporting a slight recovery in the FOB export index for Total Commodities,[1] which rose by +0.6% in dollar terms in September. Higher energy prices were only partially passed through to the FOB prices of industrial products, moderating their decline without reversing the downward trend. The China Industrial Index[2] recorded a month-on-month change of -0.4% in dollar terms, compared with -1.2% in the previous month.
The following chart compares the trends in Chinese export FOB prices, expressed in dollars, for the two aggregate indices.
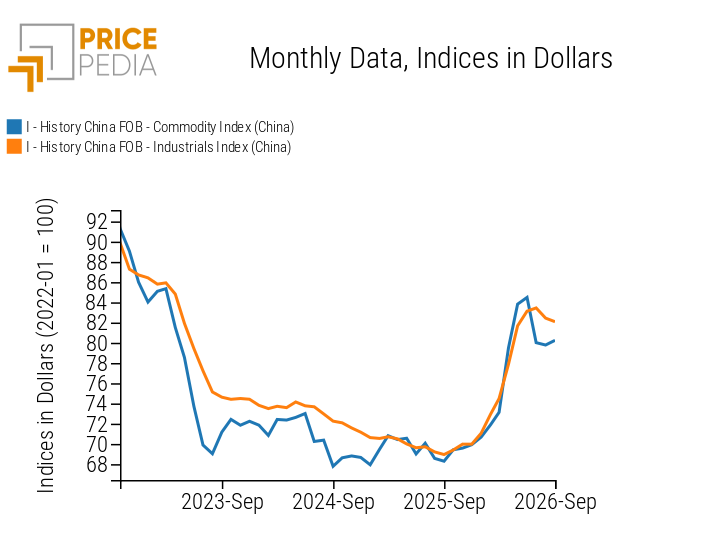
The decline in FOB prices for Chinese industrial exports over the past two months is mainly attributable to intense competitive pressure in China's manufacturing sector, driven by production capacity exceeding domestic demand. These pressures outweighed the increase in energy prices in September, which was not enough to reverse the downward trend in industrial prices.
Despite the recent decline, Chinese industrial export FOB prices remained significantly higher in September than in the same month of 2025, with year-on-year growth exceeding 19%.
Do you want to stay up-to-date on commodity market trends?
Sign up for PricePedia newsletter: it's free!
Analysis of Chinese industrial commodities by product category
The following table shows month-on-month changes in the dollar prices of Chinese exports across all product categories included in the industrial commodities aggregate.
Month-on-month changes in Chinese industrial commodity prices by product category, in dollars
| 2026-04 | 2026-05 | 2026-06 | 2026-07 | 2026-08 | 2026-09 | |
|---|---|---|---|---|---|---|
| I-History China FOB-Ferrous Metals Total Index (China) | +0.57 | +0.99 | −0.65 | +3.44 | −0.41 | −0.03 |
| I-History China FOB-Non Ferrous Metals Total Index (China) | +1.43 | +4.79 | +2.11 | −0.29 | +0.74 | +0.64 |
| I-History China FOB-Plastics and Elastomers Total Index (China) | +7.34 | +6.34 | +2.05 | −2.21 | −3.27 | −0.51 |
| I-History China FOB-Organic Chemicals Total Index (China) | +13.56 | +7.89 | +2.62 | −2.59 | −4.66 | −1.37 |
| I-History China FOB-Inorganic Chemicals Total Index (China) | +7.03 | +7.04 | +4.26 | +3.63 | −0.75 | −2.26 |
| I-History China FOB-Specialty Chemicals Total Index (China) | +2.49 | +5.25 | +2.78 | +6.42 | +0.64 | −3.44 |
| I-History China FOB-Pharmaceutical Chemicals Total Index (China) | +16.34 | +5.88 | +1.51 | +0.09 | −5.35 | −2.64 |
| I-History China FOB-Textile Fibers Total Index (China) | +6.55 | +4.85 | +1.93 | −0.42 | −0.87 | +1.00 |
The table shows that in September, the steepest price declines affected Chemicals. In particular, Specialty Chemicals recorded the sharpest drop, at -3.4% in dollar terms compared with August.
Among the other product categories, prices for Plastics and Elastomers fell by -0.5%, those for Ferrous Metals remained stable, while Textile Fibres and Non-Ferrous Metals rose by +1.0% and +0.6%, respectively.
Within Textile Fibres, the sharpest increases affected synthetic materials most exposed to input costs linked to the petrochemical supply chain, particularly polyester yarns and polypropylene, which rose by +4.5% and +3.1%, respectively.
Among Non-Ferrous Metals, roasted molybdenum ores stood out, rising by +7.5% compared with August 2026 levels.
[1] The PricePedia China Total Commodities FOB Index is calculated by aggregating the FOB indices for industrial and energy commodities.
[2] The PricePedia China Industrial Products FOB Price Index is calculated by aggregating the FOB indices for the following product categories: Ferrous Metals, Non-Ferrous Metals, Plastics and Elastomers, Organic Chemicals, Inorganic Chemicals, Specialty Chemicals, Pharmaceutical Chemicals and Textile Fibres.
You may be interested in:

Commodity markets influenced by supply tensions and interest rate expectations
Published by Luca Sazzini. .
Conjunctural Indicators Commodities Financial WeekThe announcement of new production cuts in Indonesia is boosting the nickel market’s recovery [ Read all ]

Commodity markets dominated by supply uncertainties and inflationary pressures
Published by Luca Sazzini. .
Conjunctural Indicators Commodities Financial WeekThe EU is tightening sanctions against Russia, while the U.S. is considering further easing of restrictions [ Read all ]

Commodity prices between geopolitics and supply imbalances
Published by Luca Sazzini. .
Conjunctural Indicators Commodities Financial WeekWeak Chinese demand is pushing down prices for ferrous metals [ Read all ]