PricePedia Scenario for October 2026
The new escalation renews upward pressure on industrial commodity prices
Published by Pasquale Marzano. .
Forecast Forecast
The PricePedia Forecast Scenario, developed on the basis of information available as of October 1, 2026, continues to be shaped by high geopolitical uncertainty. During September, the renewed escalation of the conflict in the Persian Gulf was accompanied by intensifying tensions between Russia and Ukraine, adding further pressure to energy markets.
As described in the latest commodity update, euro-denominated energy commodity prices rose by around +13% on average in September compared with August, while Brent crude prices moved back above $100 per barrel. The increase in geopolitical risk does not concern only the availability of oil and natural gas, but also the ability of the international energy system to ensure stable transport and refining operations.
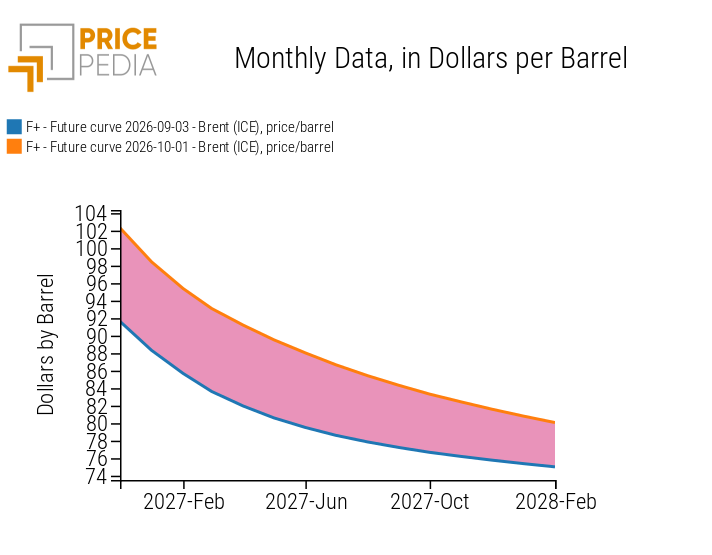
The deterioration in the energy outlook is also clearly reflected in financial market expectations. The charts below compare the Brent crude and TTF natural gas futures curves observed on October 1 with those recorded on September 3, 2026.
Energy Commodity Futures Curves
Brent crude oil, USD/barrel
TTF natural gas, EUR/MWh
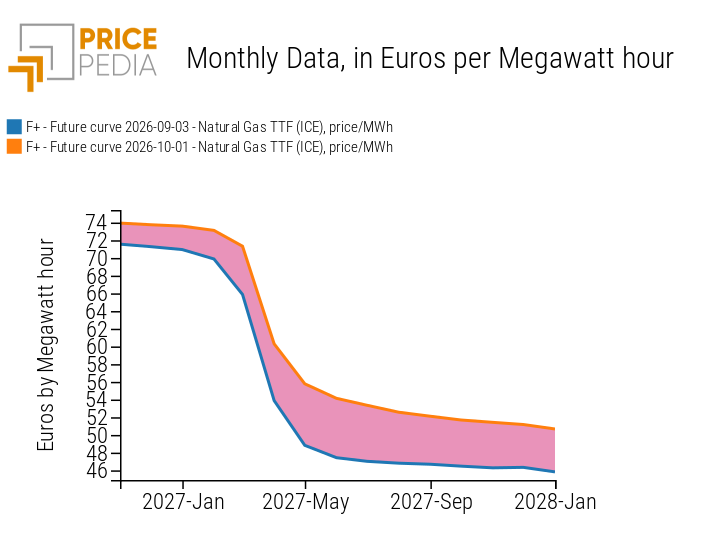
For both commodities, October quotations are higher across the entire horizon considered, indicating that the market has incorporated a higher geopolitical risk premium over the past month.
In the case of Brent crude, prices rise from just above $90 to more than $100 per barrel. Both curves nevertheless retain a downward-sloping profile, pricing in a gradual easing of tensions over the medium term. Compared with September, however, this normalisation takes place at significantly higher price levels, with quotations remaining close to $80 per barrel even at the far end of the curve.
For TTF natural gas, the revision is even more pronounced for 2027 maturities. After the sharp decline expected between the end of winter and spring 2027, the curve observed at the beginning of last month fell rapidly below €50/MWh. By contrast, the October 1 curve shows a much more limited decline, stabilising above €50/MWh in the second half of 2027, consistent with a reassessment of expectations for a near-term normalisation in European gas prices.
The new futures curves imply an upward revision to the PricePedia scenario for Brent and TTF. The assumption of a gradual easing of tensions during 2027 remains in place, but compared with the September scenario, the return to less strained conditions is expected to be slower and, above all, to occur at higher price levels. This implies that significant pressure on energy costs is likely to persist, with indirect effects on the prices of the most energy-intensive and petrochemical-related supply chains.
Persistently high energy prices are also continuing to add pressure to euro area inflation, which is forecast at 3.2% in 2026 and 2.9% in 2027, in both cases above the European Central Bank's (ECB) 2% target. More persistent inflation increases the likelihood of further monetary policy tightening in the final part of 2026, following the rate increase decided by the ECB in mid-September.
Tighter monetary conditions are expected to translate into slower growth in global industrial production, a key indicator of worldwide commodity demand. After an expected increase of +2.5% in 2026, supported in part by strong demand for high-tech products and investment in infrastructure linked to the development of artificial intelligence, growth is expected to slow to +1.4% in 2027. This implies a decline of around half a percentage point in the global industrial cycle[1] during 2027, signalling a gradual weakening of demand-side pressures on commodity markets.
PricePedia October 2026 Scenario
The outlook described above leads to a further upward revision in European energy commodity prices, which are expected to average +30.7% above the previous year's levels in 2026. In 2027, prices are instead forecast to decline by -6.8%, a smaller decrease than in the previous scenario, under the assumption that geopolitical tensions ease more gradually. This also affects the outlook for aggregate commodity prices, which are expected to increase by +15.5% in 2026 and decline by -2.5% in 2027.
The table below shows the annual percentage changes, expressed in euros, for the main commodity aggregates included in the PricePedia Scenario: Industrial Commodities[2], Total Commodities[3], Energy Commodities and Food Commodities.
Table 1: Annual percentage changes (%) in PricePedia Aggregate Indices, in euros
| 2024 | 2025 | 2026f | 2027f | |
|---|---|---|---|---|
| I-Forecast Scenario, 1 Oct. 2026 Info-Commodity Index (Europe) | −4.11 | −4.90 | +15.45 | −2.45 |
| I-Forecast Scenario, 1 Oct. 2026 Info-Energy Total Index (Europe) | −6.16 | −11.67 | +30.68 | −6.80 |
| I-Forecast Scenario, 1 Oct. 2026 Info-Industrials Index (Europe) | −4.65 | −3.17 | +8.01 | +3.02 |
| I-Forecast Scenario, 1 Oct. 2026 Info-Food Total Index (Europe) | +8.83 | +17.10 | −8.19 | −1.43 |
On average in 2026, industrial commodity prices are expected to rise by +8% compared with the previous year, largely reflecting the increases already accumulated during the year as the energy shock has passed through to raw material and production costs. In 2027, prices are expected to increase by +3%. This slowdown is consistent with the gradual easing of these pressures.
Over the 2026-2027 period, the strongest increases are expected mainly in supply chains that are most exposed to higher natural gas and petrochemical feedstock prices. Among these, fertiliser prices are projected to rise by more than +40% overall, also supported by the sharp increase in sulphuric acid, a key input for the sector. Thermoplastic polymers and organic anhydrides are also expected to record significant increases, exceeding +19% over the two-year period.
Among sectors less directly linked to petrochemicals, non-ferrous metals are nevertheless expected to show particularly strong growth, averaging more than +21% over 2026-2027. In particular, against a backdrop of potential supply constraints, strong demand linked to the twin transition continues to support copper and copper alloys, with cumulative increases above +28%, and tin, at around +50%.
Pressures on ferrous metals are more moderate, but still significant. Within this group, the largest increases are expected for hot-rolled steel coils and welded steel tubes, both projected to rise by more than +15% over the two-year period.
Conclusions
Geopolitical risk continues to be one of the main sources of uncertainty for forecasting scenarios, also because energy shocks are gradually transmitted to costs across different industrial supply chains.
In this context, Procurement functions increasingly need to translate changes in key exogenous variables, often subject to differing assessments among analysts, into their expected effects on purchased materials and procurement budgets.
The PricePedia Scenario is updated monthly precisely to incorporate changes in the external environment as quickly as possible and, through forecasting models, transmit their effects to individual commodities and the main industrial supply chains.
1. The global industrial cycle index is constructed by purifying the actual dynamics of industrial production from its trend. Since the supply of commodities tends to vary according to long-term economic growth expectations, while the demand for commodities is more linked to actual cyclical uses, the global industrial cycle index tends to reproduce the conditions of tension between demand and supply on the commodity market: when it increases, it means that the demand for commodities increases more than the supply; vice versa when it decreases.
2. The PricePedia Industrials index results from the aggregation of the indices relating to the following product categories: Ferrous, Non-Ferrous, Wood and Paper, Chemicals: Specialty, Organic Chemicals, Inorganic Chemicals, Plastics and Elastomers and Textile Fibres.
3. The PricePedia Commodity index results from the aggregation of the indices relating to industrial, food and energy commodities.
You may be interested in:

Cobalt: is the price decline set to continue?
Published by Luca Sazzini. .
Forecast Cobalt ForecastPrevisioni dei prezzi del cobalto LME 2026-2027 [ Read all ]
Crude steel production on the decline: how are forecasts for ferrous metals changing?
Published by Luca Sazzini. .
Ferrous Metals Forecast ForecastThe decline in crude steel production and the escalation in the Middle East are affecting the PricePedia outlook for ferrous metal prices [ Read all ]

PricePedia Scenario for September 2026
Published by Pasquale Marzano. .
Forecast ForecastPurchase material prices amid geopolitical tensions and supply shortages [ Read all ]