China economic update August 2026
Increased competitive pressure is driving down the prices of Chinese commodities
Published by Luca Sazzini. .
Conjunctural Indicators Global Economic Trends
In the July economic update, it was highlighted that the decline in energy prices had interrupted the growth phase of Chinese commodity prices. In August, despite the recovery in international energy prices, Chinese commodity prices continued to decline.
In aggregate terms, the FOB dollar indices of Chinese exports for Total Commodities[1] and Industrial Commodities[2] recorded month-on-month changes of -0.4% and -1.5%, respectively.
In euro terms, the declines in the same indices were even more pronounced, at -1.9% and -3.0%, respectively, reflecting the appreciation of the euro against the dollar during August.
The following chart shows the dynamics, expressed in dollars, of the FOB prices of Chinese exports for the two aggregate indices.
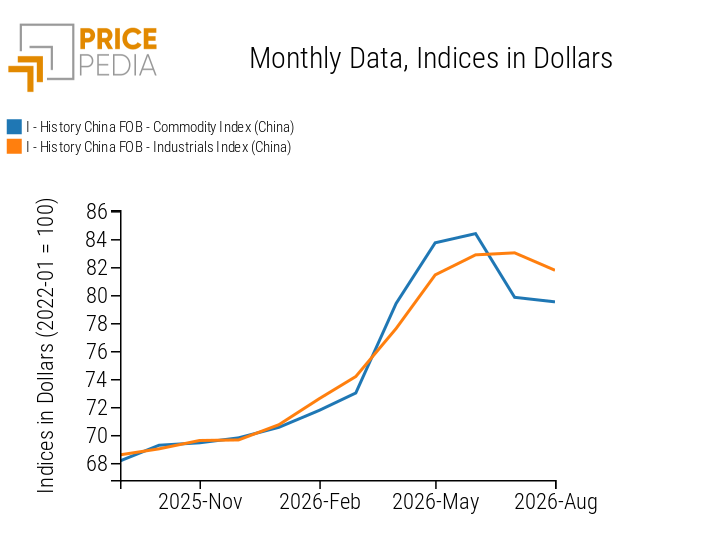
In August, the decline in Chinese commodity export prices was consistent with the intensification of competitive pressure within China's industrial sector. This pressure reached such high levels that the Chinese authorities intervened to address “disorderly” low-price competition. On September 3, the National Development and Reform Commission and the State Administration for Market Regulation published new guidelines on cost determination criteria for certain industrial products, providing more precise benchmarks for identifying cases of excessively low prices[3].
Do you want to stay up-to-date on commodity market trends?
Sign up for PricePedia newsletter: it's free!
Analysis of Chinese industrial commodities by commodity category
The table below shows the month-on-month changes in dollar-denominated prices of Chinese exports for all commodity categories included in the industrial commodities aggregate.
Month-on-month changes in Chinese industrial commodity prices by commodity category, expressed in dollars
| 2026-03 | 2026-04 | 2026-05 | 2026-06 | 2026-07 | 2026-08 | |
|---|---|---|---|---|---|---|
| I-Storico China FOB-Total Ferrous Metals Index (China) | +0.66 | +0.57 | +0.99 | −0.65 | +3.44 | −0.33 |
| I-Storico China FOB-Total Non-Ferrous Metals Index (China) | +2.72 | +1.43 | +4.79 | +2.11 | −0.29 | +0.75 |
| I-Storico China FOB-Total Plastics and Elastomers Index (China) | +1.67 | +7.33 | +6.33 | +1.95 | −2.21 | −3.27 |
| I-Storico China FOB-Total Organic Chemicals Index (China) | +3.94 | +13.64 | +7.91 | +2.62 | −2.31 | −4.39 |
| I-Storico China FOB-Total Inorganic Chemicals Index (China) | +4.06 | +7.64 | +7.92 | +4.37 | +2.85 | −3.94 |
| I-Storico China FOB-Total Specialty Chemicals Index (China) | +1.50 | +3.24 | +5.48 | +2.79 | +2.63 | −1.60 |
| I-Storico China FOB-Total Pharmaceutical Chemicals Index (China) | +1.50 | +16.34 | +5.88 | +1.51 | +0.09 | −5.35 |
| I-Storico China FOB-Total Textile Fibers Index (China) | +2.31 | +6.55 | +4.84 | +1.93 | −0.42 | −0.86 |
With the exception of Non-Ferrous Metals, which posted a monthly increase of 0.8%, all other commodity categories recorded lower prices in August. The slight increase in non-ferrous metals was mainly driven by tighter conditions in the mining supply chain and a shortage of concentrates, which contributed to an increase of more than 4% in the FOB prices of copper cathodes.
The largest price declines were recorded in the Chemicals and Plastics and Elastomers categories, with the latter falling by 3.3% from July levels. Within the industrial chemicals sector, Specialty Chemicals recorded a month-on-month decline of 1.6%, while all other segments posted declines of more than 4% in absolute terms. The greater stability of Specialty Chemicals can be attributed to the month-on-month increase in FOB prices of urea, which rose by almost 12% in August. The increase was mainly driven by higher natural gas prices, its main production input. The JKM, the benchmark for the Asian natural gas market, increased by more than 15% in dollar terms in August, supported by the escalation of geopolitical tensions.
[1] The PricePedia FOB Total Commodities China Index is obtained by aggregating the FOB indices for industrial and energy commodities.
[2] The PricePedia FOB Industrial Commodities China Index is obtained by aggregating the FOB indices for the following commodity categories: Ferrous Metals, Non-Ferrous Metals, Plastics and Elastomers, Organic Chemicals, Inorganic Chemicals, Specialty Chemicals, Pharmaceutical Chemicals and Textile Fibers.
[3] For further details, see: “China moves to curb disorderly low-price competition in key industrial products”
You may be interested in:

Commodity markets between supply risks and geopolitical uncertainty
Published by Luca Sazzini. .
Conjunctural Indicators Commodities Financial WeekThe strength of the U.S. economy is bolstering expectations of a more restrictive monetary policy [ Read all ]

Uncertainty in the commodity markets remains high
Published by Luca Sazzini. .
Conjunctural Indicators Commodities Financial WeekCommodity prices show divergent trends [ Read all ]

From Hormuz to Bab el-Mandeb, tensions are rising over energy commodity prices
Published by Luca Sazzini. .
Conjunctural Indicators Commodities Financial WeekIncreased supply is driving down cobalt prices [ Read all ]