Monthly commodity prices update for July 2026
Renewed tensions in the Persian Gulf halt the downward trend in commodity prices
Published by Pasquale Marzano. .
EU Customs Global Economic TrendsIn July 2026, euro-denominated commodity prices halted the downward trend observed in previous months, against a backdrop of renewed geopolitical tensions following the period of easing triggered by the US-Iran agreement reached in June. Overall, prices edged up by 0.4%, while remaining below the relative peaks recorded during the initial phase of the conflict. Although the international outlook remains highly uncertain, recent developments suggest that the path to dialogue is still open (see the latest weekly update).
The following chart illustrates euro-denominated raw material price trends in the European market through PricePedia's main aggregates, indexed to their respective January 2022 levels: Commodity[1], Industrials[2], Energy and Food.
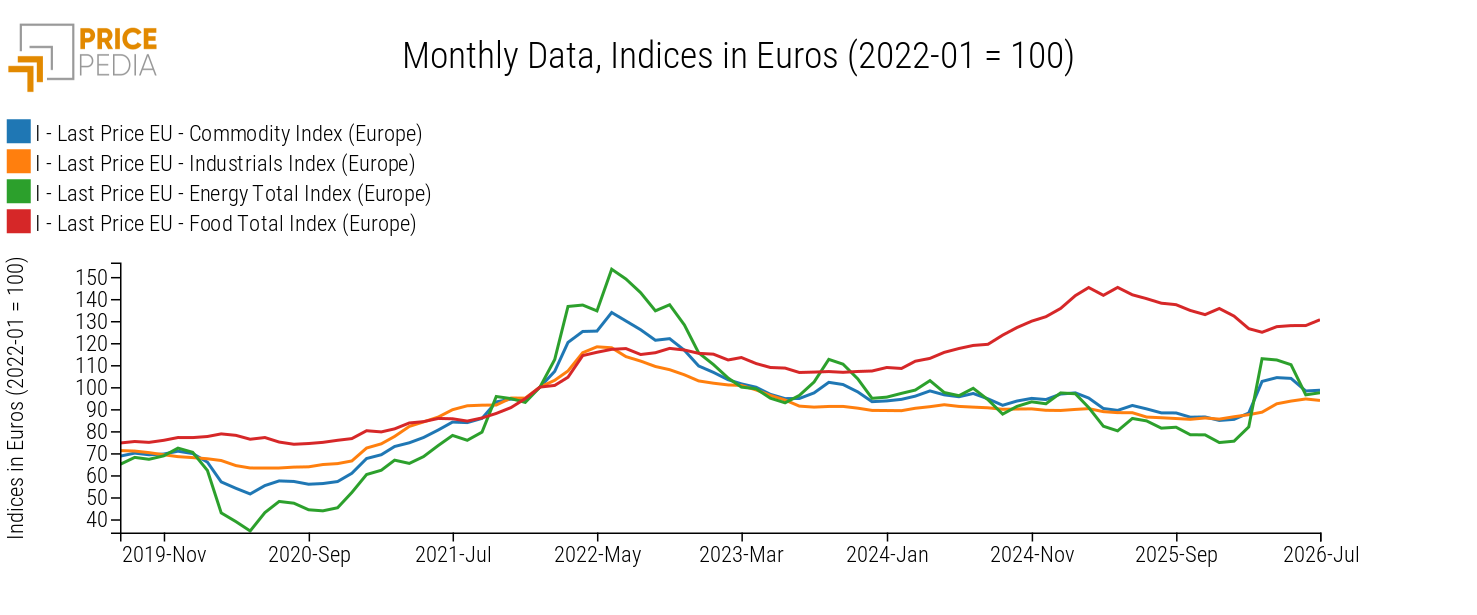
Among the macro-categories considered, food commodities recorded the strongest month-on-month growth, rising by 2.1% compared with June 2026. This increase does not appear to be directly attributable to developments in the conflict, but mainly reflects unfavourable supply conditions in specific markets, such as tropical commodities, whose prices rose by more than 4%.
Geopolitical tensions continued to affect the energy commodity segment in particular, with prices increasing overall by 1% compared with June. However, the aggregate figure conceals divergent trends across individual energy sources.
Over the same period, prices rose for fuel oils — both light and medium-to-heavy grades — and natural gas. The natural gas trend reflects the European market's sensitivity to tensions in the Persian Gulf, partly due to the important role played by LNG supplies from the region. This vulnerability is compounded by the relatively low level of European gas storage, which stood at 56% on July 28, 2026 — the lowest level recorded on the same date since 2014, with the sole exception of 2021. This reduces the European market's security buffer ahead of the next winter season.
On a monthly-average basis, crude oil followed the opposite trend in July. The deterioration in the geopolitical environment drove prices higher during the month, although the increase was less pronounced than the one recorded between March and April. In the final week of July, however, prospects of renewed dialogue triggered a fresh decline, bringing the monthly average below its June level.
The limited scale of the price increases was supported by weaker demand, higher production outside the Gulf and the use of global inventories, which helped cushion the impact of the supply shock[3].
As for industrial commodities, prices edged down by 0.7% in July compared with the previous month, in line with the monthly trend in oil prices. Nevertheless, they remained more than 7% above their February 2026 average, before the conflict began.
Industrial Raw Material Price Trends
The following table breaks down the industrial commodity index into its main subcategories and reports the month-on-month changes in euro-denominated prices recorded for each of them between February and July.
Table 1: Month-on-Month Changes (%) in PricePedia Aggregate Indices, in Euros
| 2026-02 | 2026-03 | 2026-04 | 2026-05 | 2026-06 | 2026-07 | |
|---|---|---|---|---|---|---|
| I-Last Price EU-Plastics and Elastomers Total Index (Europe) | −0.21 | +3.24 | +10.01 | +2.27 | +2.54 | −2.65 |
| I-Last Price EU-Textile Fibers Total Index (Europe) | +1.67 | +0.73 | +5.59 | +1.23 | +1.26 | −1.38 |
| I-Last Price EU-Non Ferrous Metals Total Index (Europe) | +2.38 | +0.91 | +4.04 | +1.95 | +1.38 | −0.55 |
| I-Last Price EU-Organic Chemicals Total Index (Europe) | +0.46 | +3.15 | +6.52 | +2.08 | +1.57 | −0.52 |
| I-Last Price EU-Specialty Chemicals Total Index (Europe) | +0.42 | +1.68 | +2.43 | −1.28 | −0.58 | −0.18 |
| I-Last Price EU-Ferrous Metals Total Index (Europe) | +1.40 | +0.29 | +0.78 | +1.36 | +0.55 | −0.03 |
| I-Last Price EU-Wood and Paper Total Index (Europe) | +2.23 | −0.35 | +3.59 | +0.04 | −1.13 | 0.00 |
| I-Last Price EU-Inorganic Chemicals Total Index (Europe) | −0.79 | +1.71 | +1.38 | −0.51 | +1.98 | +0.27 |
After four consecutive months of growth, plastics and elastomers recorded the sharpest correction in July, falling by 2.7%. This decline was consistent with the monthly drop in oil prices and international financial benchmarks for the sector, which fell overall by -3.8% compared with the previous month. Despite this correction, prices in the segment remain approximately 16% above their February average.
A more moderate correction affected textile fibres, whose prices fell by 1.4% compared with June, mainly due to synthetic fibres, which declined by -2.7%. Among the other core industrial commodity categories, non-ferrous metals and organic chemicals recorded decreases of around half a percentage point, while changes in the remaining categories were contained within 0.3% in absolute terms.
Do you want to stay up-to-date on commodity market trends?
Sign up for PricePedia newsletter: it's free!
1. The PricePedia Commodity index is the aggregation of Industrials, Food and Energy indices.
2. The PricePedia Industrials index is the aggregation of indices related to the following categories: Ferrous Metals, Non-Ferrous Metals, Wood and Paper, Pharmaceutical Chemicals, Chemicals: Specialty, Organic Chemicals, Inorganic Chemicals, Plastics and Elastomers, and Textile Fibers.
3. See the International Monetary Fund (IMF) Blog.
You may be interested in:
Monthly commodity prices update for August 2026
Published by Pasquale Marzano. .
EU Customs Global Economic TrendsEuropean commodity prices continue to rise [ Read all ]
Monthly commodity prices update for June 2026
Published by Pasquale Marzano. .
EU Customs Global Economic TrendsCommodity prices show mixed trends following the US-Iran peace agreement [ Read all ]
Monthly commodity prices update for May 2026
Published by Pasquale Marzano. .
EU Customs Global Economic TrendsEuropean prices of purchased materials up +17% since the start of the Iran conflict [ Read all ]