Monthly commodity prices update for August 2026
European commodity prices continue to rise
Published by Pasquale Marzano. .
EU Customs Global Economic TrendsIn August 2026, euro-denominated commodity prices rose by more than 2% compared with the previous month. Price dynamics continued to be shaped by geopolitical developments and, above all, by uncertainty surrounding transit through the Strait of Hormuz. The Strait remains officially closed and, although traffic has not come to a complete halt, it is still below pre-conflict levels.
The following chart illustrates the performance of euro-denominated commodity prices on the European market through PricePedia’s main aggregates, indexed to their respective January 2022 levels: Commodity[1], Industrials[2], Energy and Food.
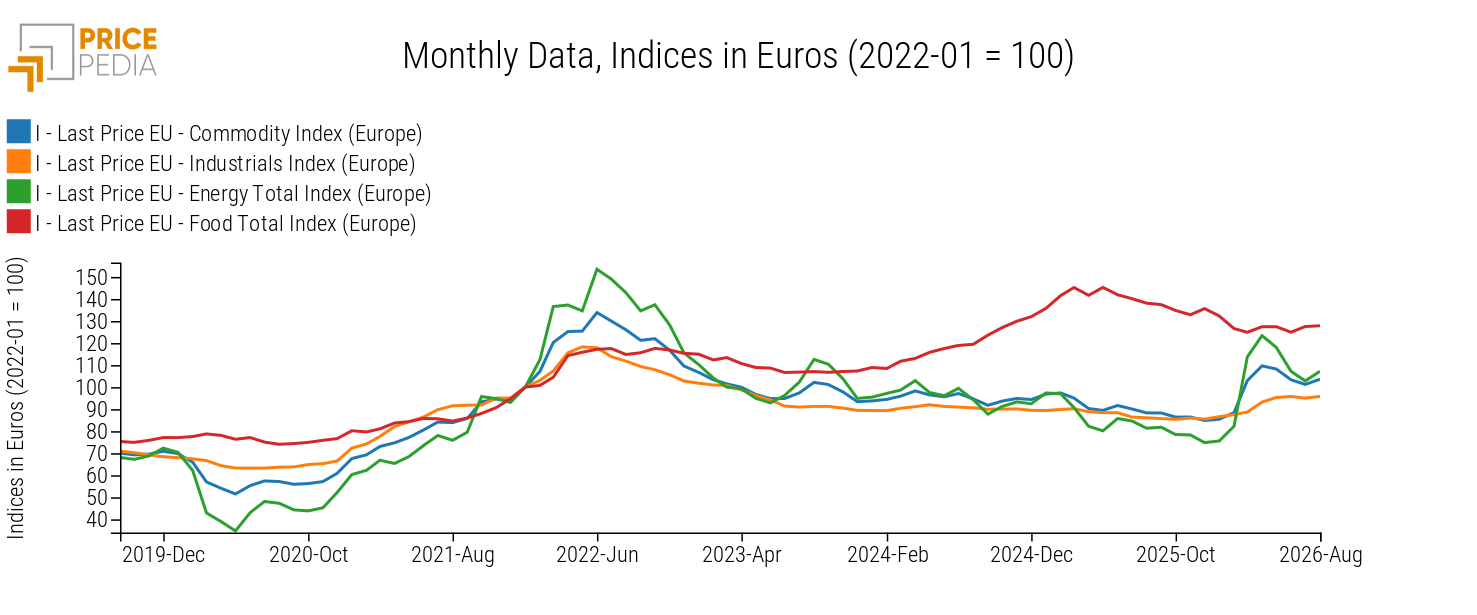
In August, all the broad commodity categories considered recorded month-on-month price increases, although to varying degrees. European food commodity prices posted a moderate increase of 0.3%. Within this category, wheat prices rose by almost 4% compared with the previous month, amid concerns that supply may fall short of market expectations and renewed tensions related to the conflict between Russia and Ukraine, two of the world’s leading grain producers.
Among the other broad categories, energy commodities recorded the strongest increase in August, rising by 4% compared with July 2026. Unlike the developments described in the previous update, the increase was supported by both oil and natural gas prices. Within the energy sector, the largest rise over the same period was recorded by Medium and Heavy Oils products, particularly diesel and fuel oils, which increased by a combined 5.7% compared with the previous month. The increase in light oils products was more moderate, averaging 1.2% month-on-month.
Industrial commodity prices also increased, although more moderately, rising by 0.8% compared with July. Prices in this segment remain close to the recent highs reached in the months following the outbreak of the conflict between the United States and Iran. In August, they stood almost 10% above their pre-conflict average of February 2026. Persistently high industrial commodity prices reflect the more gradual transmission of energy-related pressures over time and across different production chains, with stronger effects in sectors that are more heavily exposed to petrochemical feedstocks.
Industrial commodity price dynamics since the start of the conflict
To understand which industrial value chains are experiencing the greatest pressures, it is useful to break down the aggregate trend in industrial commodities and examine price developments across individual product categories.
The following chart shows the percentage changes in euro-denominated prices for the main industrial subcategories between February and August 2026.
Chart 2: Percentage changes in euro-denominated prices, August 2026 compared with February 2026
Source: PricePedia
With the exception of pharmaceutical chemicals, whose prices declined slightly, all product categories recorded higher average prices than in February 2026, confirming the trend observed at the aggregate level.
The sharpest increases over the period affected the categories most exposed to developments in petrochemical value chains. In particular, prices for Organic Chemicals and Plastics and Elastomers rose by more than 16%. These sectors’ greater exposure to petroleum derivatives results in a faster transmission of higher energy and raw-material costs along the value chain.
Non-Ferrous Metals also recorded strong growth, with prices increasing by more than 11% between February and August. In this case, the trend appears to be more closely linked to supply-side concerns, particularly for copper and zinc.
The remaining product categories recorded more moderate increases of less than 10%. Among these, Ferrous Metals rose by just over 3.5% between February and August 2026, confirming that the transmission of the shock has so far been more limited than in categories with greater exposure to energy-related factors and supply-side pressures.
Do you want to stay up-to-date on commodity market trends?
Sign up for PricePedia newsletter: it's free!
1. The PricePedia Commodity index is the aggregation of Industrials, Food and Energy indices.
2. The PricePedia Industrials index is the aggregation of indices related to the following categories: Ferrous Metals, Non-Ferrous Metals, Wood and Paper, Pharmaceutical Chemicals, Chemicals: Specialty, Organic Chemicals, Inorganic Chemicals, Plastics and Elastomers, and Textile Fibers.
You may be interested in:
Monthly commodity prices update for July 2026
Published by Pasquale Marzano. .
EU Customs Global Economic TrendsRenewed tensions in the Persian Gulf halt the downward trend in commodity prices [ Read all ]
Monthly commodity prices update for June 2026
Published by Pasquale Marzano. .
EU Customs Global Economic TrendsCommodity prices show mixed trends following the US-Iran peace agreement [ Read all ]
Monthly commodity prices update for May 2026
Published by Pasquale Marzano. .
EU Customs Global Economic TrendsEuropean prices of purchased materials up +17% since the start of the Iran conflict [ Read all ]