Commodity prices driven by the risk of the conflict escalating
Houthi attacks in the Red Sea are increasing the risk of disruptions to energy supplies
Published by Luca Sazzini. .
Conjunctural Indicators Commodities Financial WeekFor the first time since May, Brent crude oil prices have risen back above $100 per barrel, driven by the deterioration of the geopolitical situation in the Middle East and increasing risks of supply disruptions. The attacks between the United States and Iran are once again putting pressure on flows through the Persian Gulf, while the threat of a blockade of the Bab el-Mandeb Strait by the Houthis is increasing uncertainty over Saudi exports from the Red Sea. Any potential blockade would force tankers heading towards Asia to avoid the Red Sea and follow a much longer alternative route through the Suez Canal and around Africa. The diversion would result in a significant increase in sailing times and transportation and insurance costs, introducing further tensions into global oil market supply chains.
The market is therefore pricing in a higher risk premium, considering that any reduction in flows from the Middle East would be difficult to offset in the short term. In addition, releases from US strategic reserves, which provided partial support to supply during the most critical phase of the conflict, will end towards the end of the month, leaving the market more exposed to new supply disruptions.
Rising supply risks for energy commodities are also affecting refined product prices, with diesel recording the most significant increases. This segment remains particularly vulnerable due to restrictions on Russian exports of refined products. Moscow may extend the export ban into next month, further reducing diesel availability on international markets.
The European natural gas sector is even more exposed, as it is being affected more significantly by instability in the Middle East. Dutch TTF prices have exceeded €65/MWh, reflecting the greater vulnerability of LNG flows from the region.
The previous normalization phase of trade flows following the Memorandum of Understanding highlighted how liquefied natural gas supplies tend to recover more slowly than oil flows. A new escalation could therefore keep price pressures high, especially considering that European storage levels are below the average of recent years just ahead of the start of the winter season.
In the precious metals sector, gold and silver initially benefited from rising geopolitical uncertainty and stronger demand for safe-haven assets. However, the price increase was subsequently reduced after the press conference held by European Central Bank President Christine Lagarde, who highlighted that the inflationary effects of the energy shock may not have fully materialized yet. Her remarks strengthened expectations of a more restrictive monetary policy, with markets beginning to price in a higher probability of interest rates remaining elevated for longer, increasing the opportunity cost of safe-haven assets.
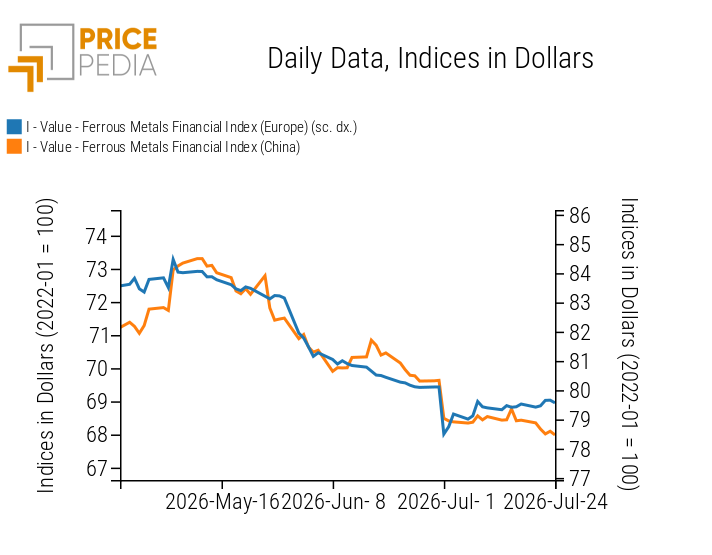
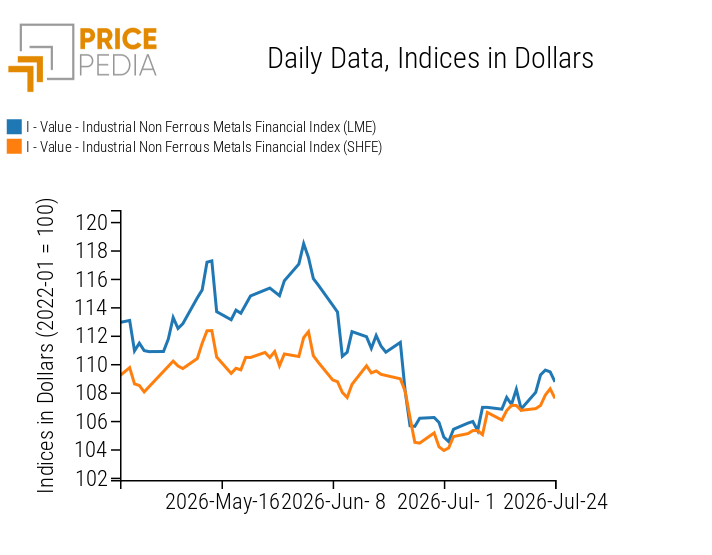
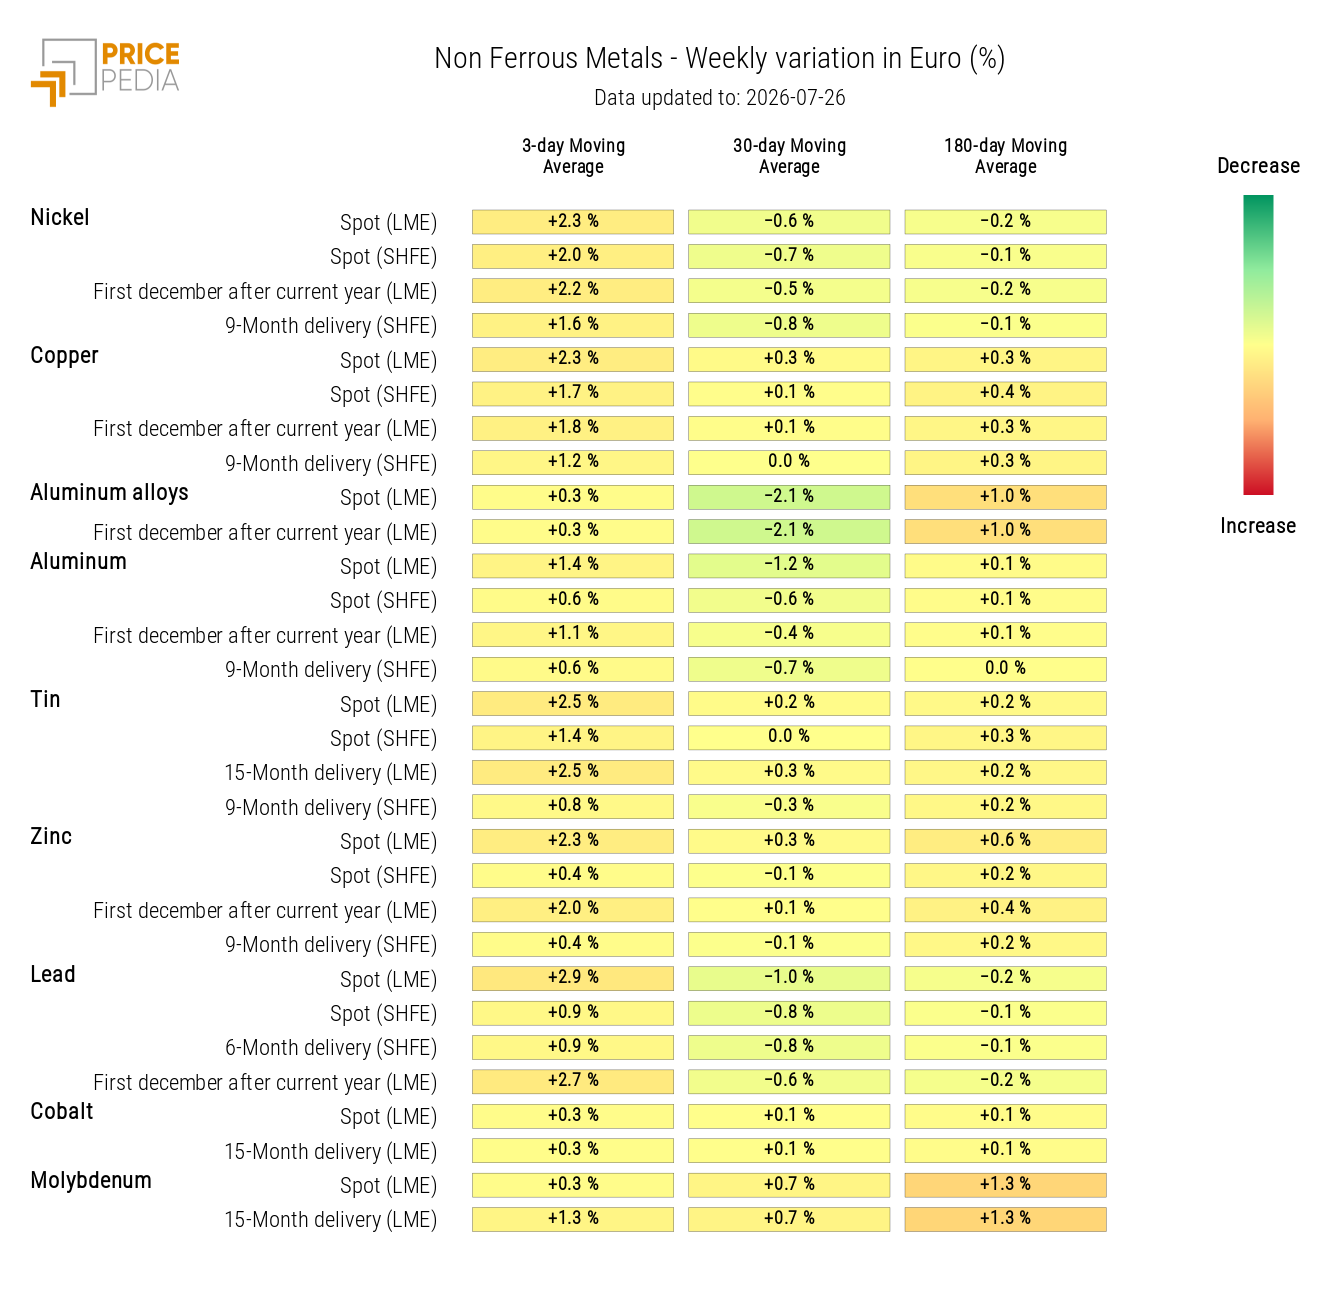
In the industrial metals sector, prices of ferrous metals are showing resilience in Europe and a decline in the Chinese market, linked to lower iron ore prices. Conversely, the main base non-ferrous metals are recording slight weekly increases. Aluminium, however, has maintained a predominantly sideways trend, despite being the industrial metal most exposed to geopolitical developments in the Middle East, given the region’s significant role in global primary aluminium production, accounting for around 10% of total worldwide output.
The July 20 proclamation under Section 232 of the Trade Expansion Act does not appear to have significantly changed aluminium price dynamics either. The new measure introduces the possibility for companies building, expanding, or refurbishing aluminium smelting facilities in the United States to access a reduced tariff rate on imports, equal to 25% compared with the standard 50% duty, provided that specific approved investment targets are achieved.
The initiative aims to support the revival of domestic primary aluminium production after years of gradual decline in US production capacity, but its effects are expected to emerge mainly over the medium to long term.
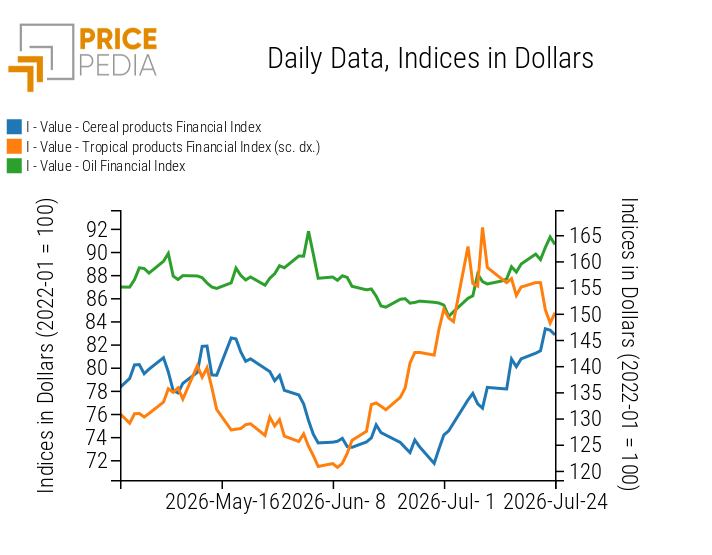
Among food commodities, last week’s trends continue, with bullish dynamics for cereals and oils, while tropical products are declining, driven by lower prices for coffee and cocoa.
NUMERICAL APPENDIX
ENERGY
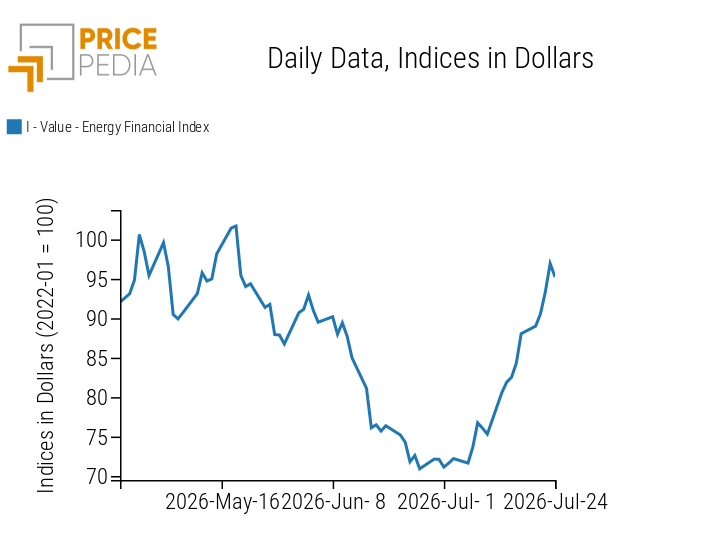
The upward trend of the PricePedia financial index for energy products continues, driven by rising geopolitical tensions in the Middle East.
PricePedia Financial Index of Energy Prices in Dollars
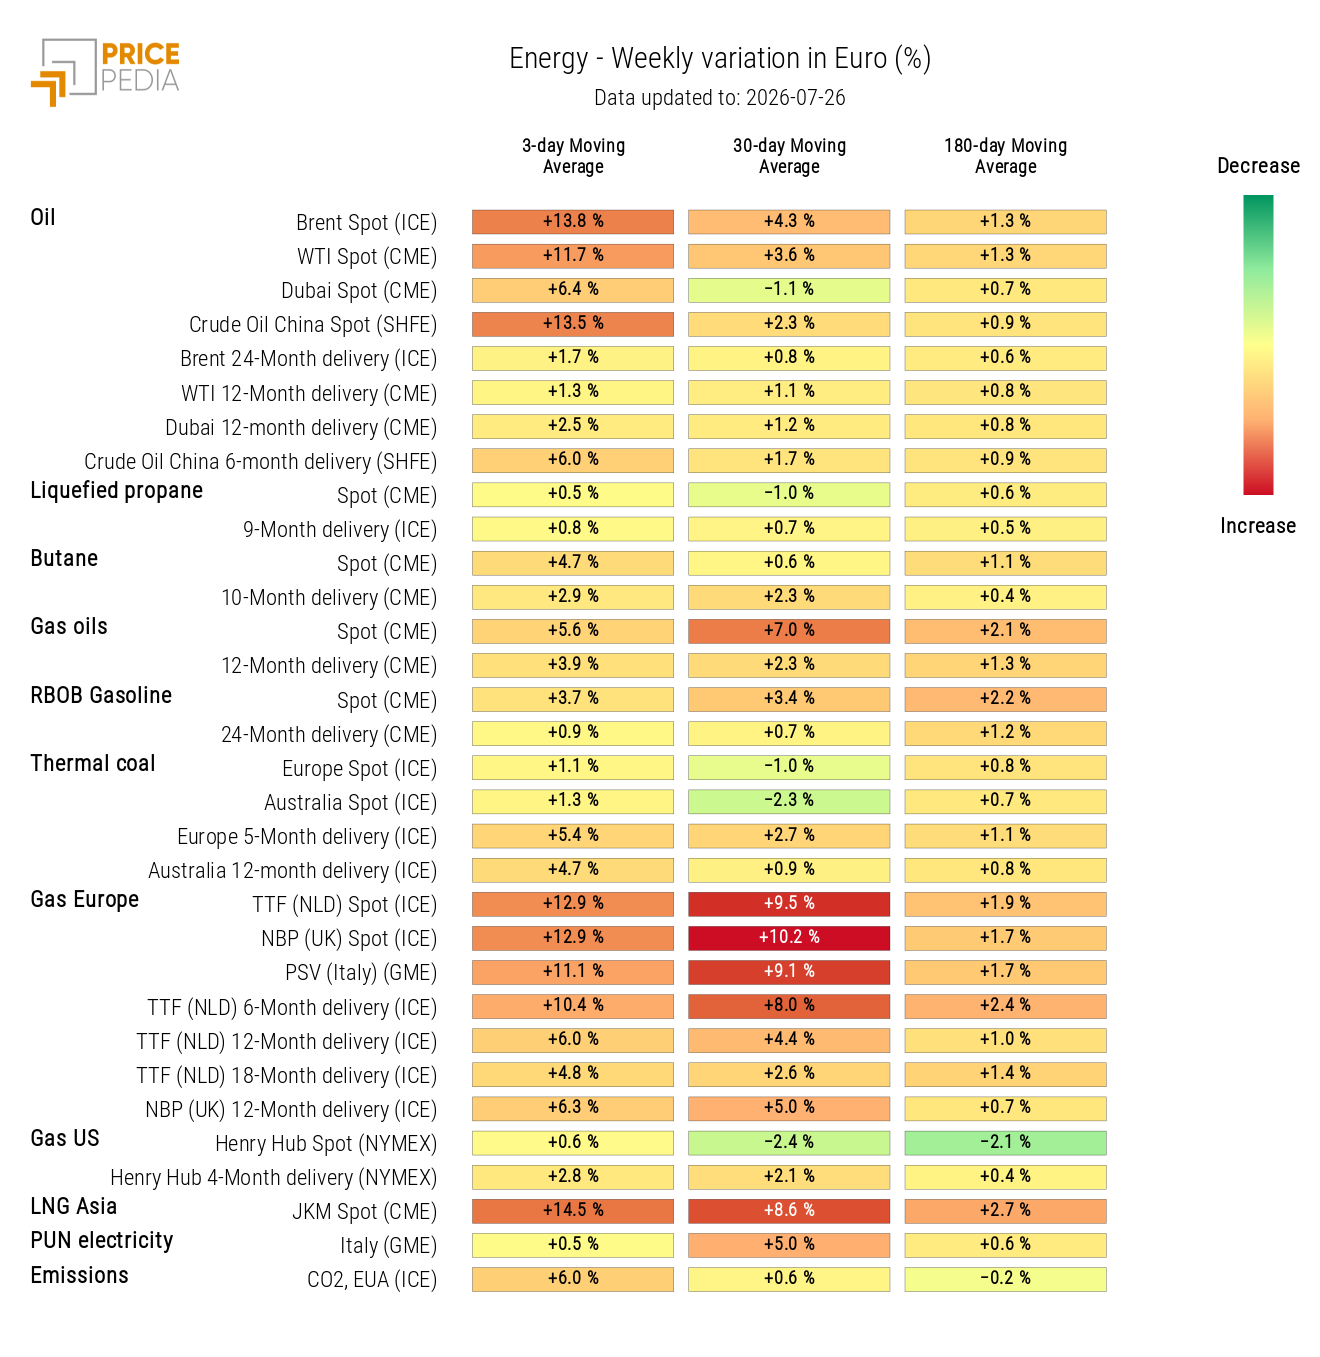
The energy commodities heatmap highlights the strong increase in oil and natural gas prices.
HeatMap of Energy Commodity Prices in Euro
PLASTICS AND ELASTOMERS
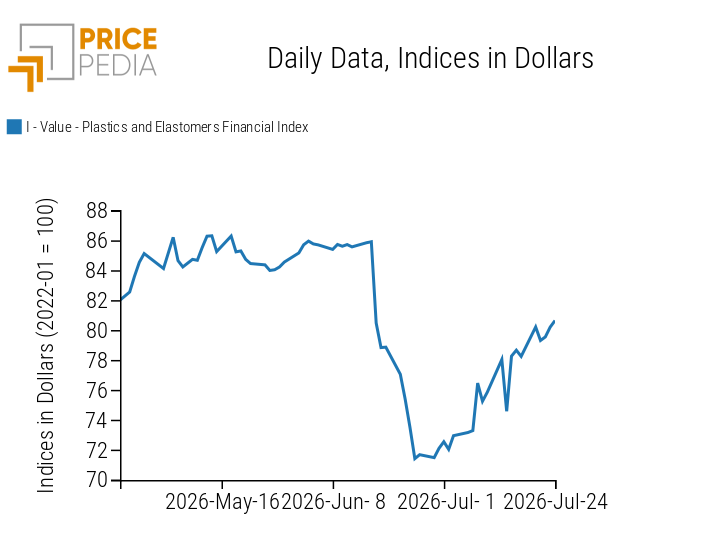
The financial index of plastic and elastomer prices confirms its new recovery phase.
PricePedia Financial Index of Plastic and Elastomer Prices in Dollars
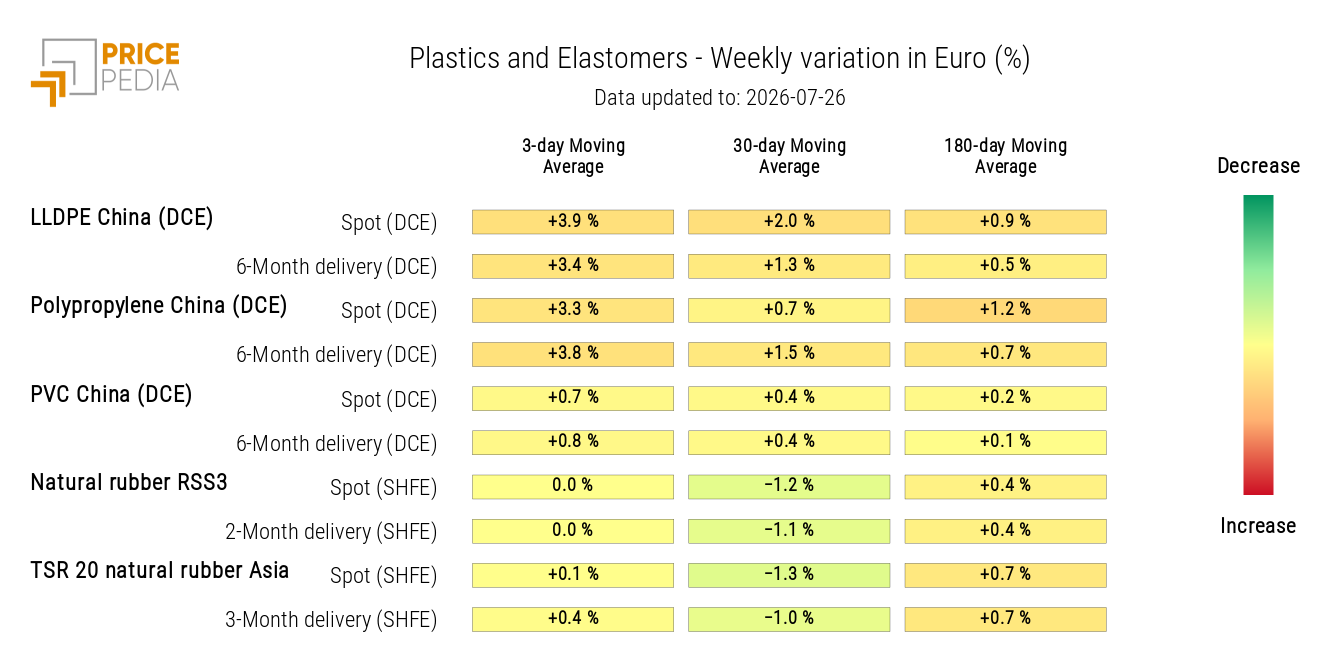
The heatmap of thermoplastics and elastomers indicates a weekly increase in the 3-day moving average prices of LLDPE and polypropylene.
HeatMap of Plastic and Elastomer Prices in Euro
FERROUS METALS
The European ferrous metals index shows price stability, while the Chinese index continues its downward trend.
PricePedia Financial Indices of Ferrous Metal Prices in Dollars
Do you want to stay up-to-date on commodity market trends?
Sign up for PricePedia newsletter: it's free!
INDUSTRIAL NON-FERROUS METALS
Despite short-term fluctuations, the two non-ferrous metal indices continue to follow a price recovery trend.
PricePedia Financial Indices of Industrial Non-Ferrous Metal Prices in Dollars
The heatmap analysis highlights a slight weekly increase in the prices of the main base non-ferrous metals.
HeatMap of Non-Ferrous Metal Prices in Euro
FOOD COMMODITIES
The tropical commodities financial index records a further correction, while grain and oil indices show weekly growth.
PricePedia Financial Indices of Food Commodity Prices in Dollars
CEREALS
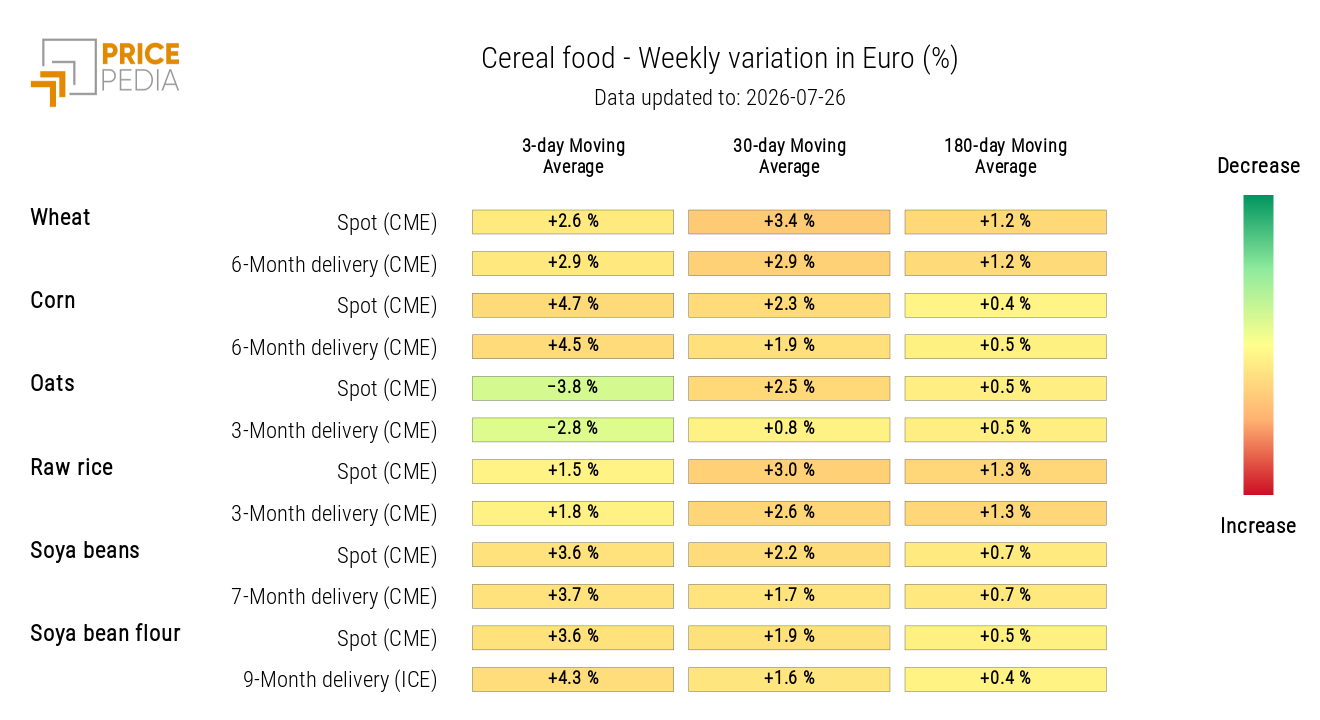
Except for oats, the cereals heatmap highlights a generalized increase in prices.
HeatMap of Cereal Prices in Euro
TROPICAL COMMODITIES
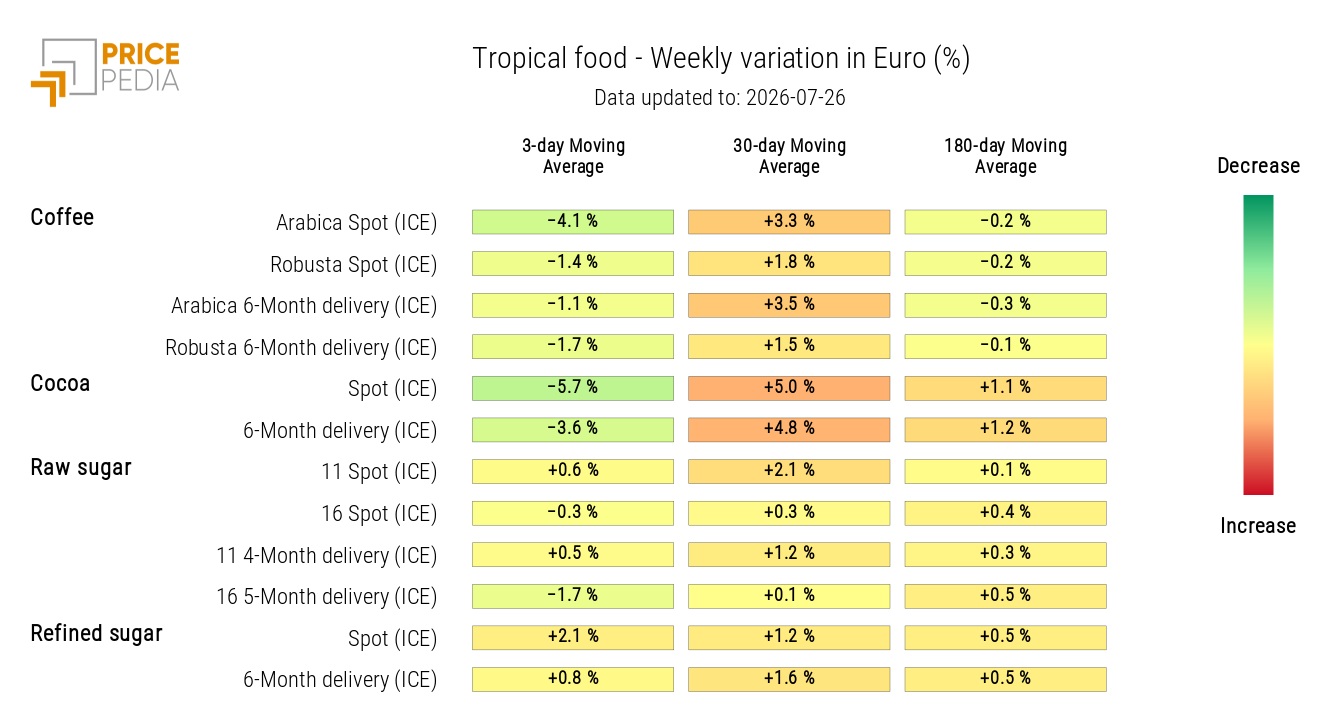
The tropical commodities heatmap indicates a weekly reduction in coffee and cocoa prices.
HeatMap of Tropical Food Commodity Prices in Euro
OILS
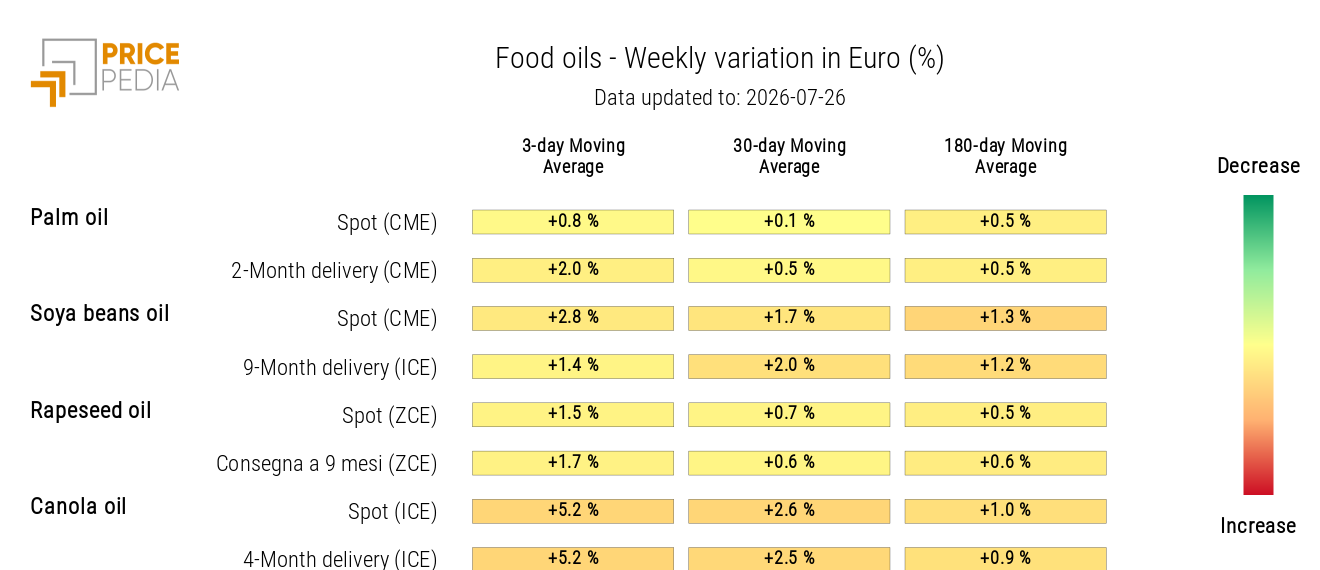
The food oils heatmap shows a weekly increase in prices, with canola oil recording the strongest growth.
HeatMap of Food Oil Prices in Euro
You may be interested in:
Commodity markets dominated by supply uncertainties and inflationary pressures
Published by Luca Sazzini. .
Conjunctural Indicators Commodities Financial WeekThe EU is tightening sanctions against Russia, while the U.S. is considering further easing of restrictions [ Read all ]
Commodity prices between geopolitics and supply imbalances
Published by Luca Sazzini. .
Conjunctural Indicators Commodities Financial WeekWeak Chinese demand is pushing down prices for ferrous metals [ Read all ]
Expectations of tighter monetary policy are weighing on commodity markets
Published by Luca Sazzini. .
Conjunctural Indicators Commodities Financial WeekThe decline in prices is affecting most sectors [ Read all ]