China economic update July 2026
The temporary decline in energy prices halts the rise in Chinese commodity prices
Published by Luca Sazzini. .
Conjunctural Indicators Global Economic Trends In the latest article on the Chinese economic outlook, “China economic update June 2026”, it was highlighted that the signing of the Memorandum of Understanding (MoU) between the US and Iran led to a slowdown in the growth of FOB prices of Chinese exports in June. This slowdown was driven both by the reduction in energy raw material costs on international markets and by the temporary resumption of traffic through the Strait of Hormuz.
On the Chinese market, the effects of the fragile geopolitical détente in June were reflected more strongly in prices in July. While FOB prices of Chinese energy products had remained substantially stable in June, showing only a slowdown in their previous growth trend, in July they recorded a marked month-on-month decline, amounting to -8.8% in dollar terms.
The contraction in Chinese FOB energy prices, in turn, led to a reduction in the aggregate FOB price index for Chinese commodities, bringing its growth to a halt in July.
The following chart shows the dynamics, over the last two years, of the FOB prices in dollars of Chinese exports for the aggregate indices of Total Commodities[1] and Industrial Commodities[2].
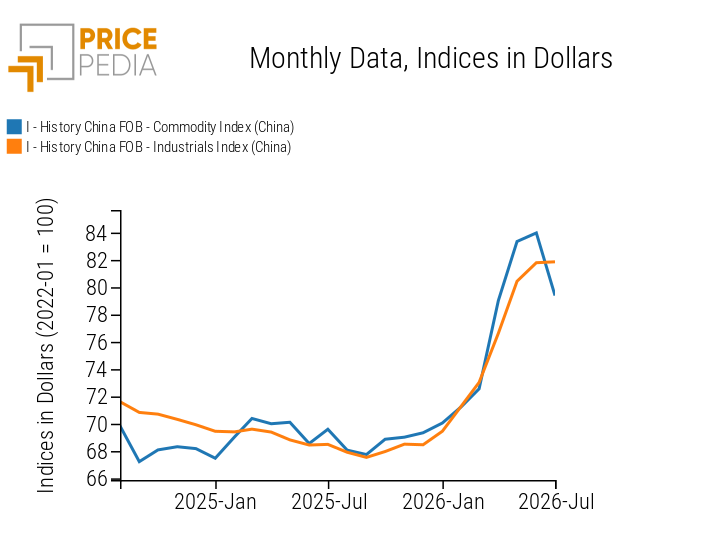
In aggregate terms, in July the Total Commodities aggregate index of FOB prices in dollars of Chinese exports recorded a month-on-month decline of -5.5%. In the same month, the FOB index of Chinese commodity prices in dollars showed substantial stability, with a month-on-month change of +0.1%.
In order to analyze the dynamics of industrial commodity prices, it may be useful to examine their evolution across the different product categories that make up the above index.
Do you want to stay up-to-date on commodity market trends?
Sign up for PricePedia newsletter: it's free!
Analysis of Chinese industrial commodities by individual product category
The table below shows the dynamics of month-on-month changes in the dollar prices of Chinese exports for all product categories included in the Industrial Commodities aggregate.
Month-on-month changes in Chinese industrial commodities by individual product category, expressed in dollars
| 2026-03 | 2026-04 | 2026-05 | 2026-06 | 2026-07 | |
|---|---|---|---|---|---|
| I-Storico China FOB-Total Ferrous Index (China) | +0.91 | +0.67 | +1.35 | −0.66 | +3.45 |
| I-Storico China FOB-Total Non-Ferrous Index (China) | +2.70 | +1.36 | +4.79 | +2.07 | −0.31 |
| I-Storico China FOB-Total Plastics and Elastomers Index (China) | +2.06 | +8.84 | +6.12 | +1.80 | −2.48 |
| I-Storico China FOB-Total Organic Chemicals Index (China) | +4.27 | +15.19 | +8.73 | +2.76 | −1.80 |
| I-Storico China FOB-Total Inorganic Chemicals Index (China) | +4.49 | +6.86 | +6.83 | +3.81 | +2.75 |
| I-Storico China FOB-Total Specialty Chemicals Index (China) | +2.03 | +2.63 | +5.50 | +2.79 | +0.74 |
| I-Storico China FOB-Total Pharmaceutical Chemicals Index (China) | +1.50 | +16.34 | +5.88 | +1.51 | +0.09 |
| I-Storico China FOB-Total Textile Fibers Index (China) | +2.29 | +6.53 | +4.85 | +1.93 | −0.42 |
In July, the only product category to record a renewed acceleration in Chinese FOB price growth was Ferrous Metals, at +3.5% month on month. The upward trend in the sector can be attributed, at least in part, to the decline in steel production recorded in China in July, both month on month and year on year, as reported by official data from the National Bureau of Statistics of China[3].
The second product category to record the largest price increase in July was Inorganic Chemicals, which nevertheless showed a slowdown in the growth rate of prices. The increase in inorganic chemical prices was mainly driven by the persistent rise in sulfuric acid prices, linked to the current supply shortage. In July, FOB prices of sulfuric acid recorded the largest increase among the Chinese commodities monitored by PricePedia, with a month-on-month change in dollar terms of more than +50%.
All the other product categories shown in the table recorded a decline or substantial stability in prices, with month-on-month changes of less than 1% in absolute terms. The most pronounced declines affected, in particular, FOB prices of Plastics and Elastomers and Organic Chemicals, in line with the sharp reduction in Chinese FOB prices of energy products used as production inputs in their respective manufacturing processes.
[1] The PricePedia FOB index for Total Commodities China is obtained by aggregating the FOB indices for industrial and energy commodities.
[2] The FOB price index for Industrial Commodities China is obtained by aggregating the FOB indices for the following product categories: Ferrous Metals, Non-Ferrous Metals, Plastics and Elastomers, Organic Chemicals, Inorganic Chemicals, Specialty Chemicals, Pharmaceutical Chemicals and Textile Fibers.
[3] In July, Chinese crude steel production amounted to 76.93 million tonnes, down -3.6% year on year and -8.1% compared with the previous month (83.67 million tonnes in June).
You may be interested in:

Commodity markets dominated by supply uncertainties and inflationary pressures
Published by Luca Sazzini. .
Conjunctural Indicators Commodities Financial WeekThe EU is tightening sanctions against Russia, while the U.S. is considering further easing of restrictions [ Read all ]

Commodity prices between geopolitics and supply imbalances
Published by Luca Sazzini. .
Conjunctural Indicators Commodities Financial WeekWeak Chinese demand is pushing down prices for ferrous metals [ Read all ]

Expectations of tighter monetary policy are weighing on commodity markets
Published by Luca Sazzini. .
Conjunctural Indicators Commodities Financial WeekThe decline in prices is affecting most sectors [ Read all ]