How thermoplastic polymer prices are transmitted along synthetic fibre value chains
The case of nylon, polypropylene and polyester
Published by Pasquale Marzano. .
Polypropylene Textile Fibers Polyamide Polyethylene terephthalate (PET) Price DriversThe closure of the Strait of Hormuz generated severe tensions across energy feedstock markets and the associated production chains. Thermoplastic polymers and organic chemicals were among the segments most affected, with prices rising by more than 15% since the beginning of the conflict (see the June 2026 market update).
Tensions in polymer markets have increased cost pressures on downstream industries. One example is the packaging sector, where polymers account for a significant share of production costs, as discussed in the article Increasing raw material prices for food packaging.
The use of thermoplastic polymers, however, extends well beyond packaging and involves numerous other industrial value chains. These include synthetic fibres and yarns, where polyamides (nylon), polyester and polypropylene are among the main raw materials.
It is therefore important to understand the extent to which polymer price shocks are transmitted to synthetic fibre and yarn prices, and whether significant differences emerge across the various production chains.
From polymers to synthetic fibres and yarns
The thermoplastic polymers considered above are used to manufacture synthetic fibres for a wide range of textile applications, including apparel, technical textiles, furnishings, automotive components and industrial products. The two main production branches lead to continuous-filament yarns and staple fibres, which are obtained through different transformation processes.
In the case of continuous-filament yarns, the polymer is melted and extruded into continuous filaments, which may subsequently be drawn, textured, twisted or subjected to other processing stages, depending on the properties required for the final product. In the case of staple fibres, the extruded filaments are cut into short lengths. These fibres represent an intermediate product that is subsequently carded and spun to produce, for example, spun yarns.
The following figure summarises the relationships between the main production input and the intermediate products, reporting the estimated long-run elasticities across the nylon, polyester and polypropylene value chains. These elasticities show how price changes are transmitted from the polymer to downstream products.
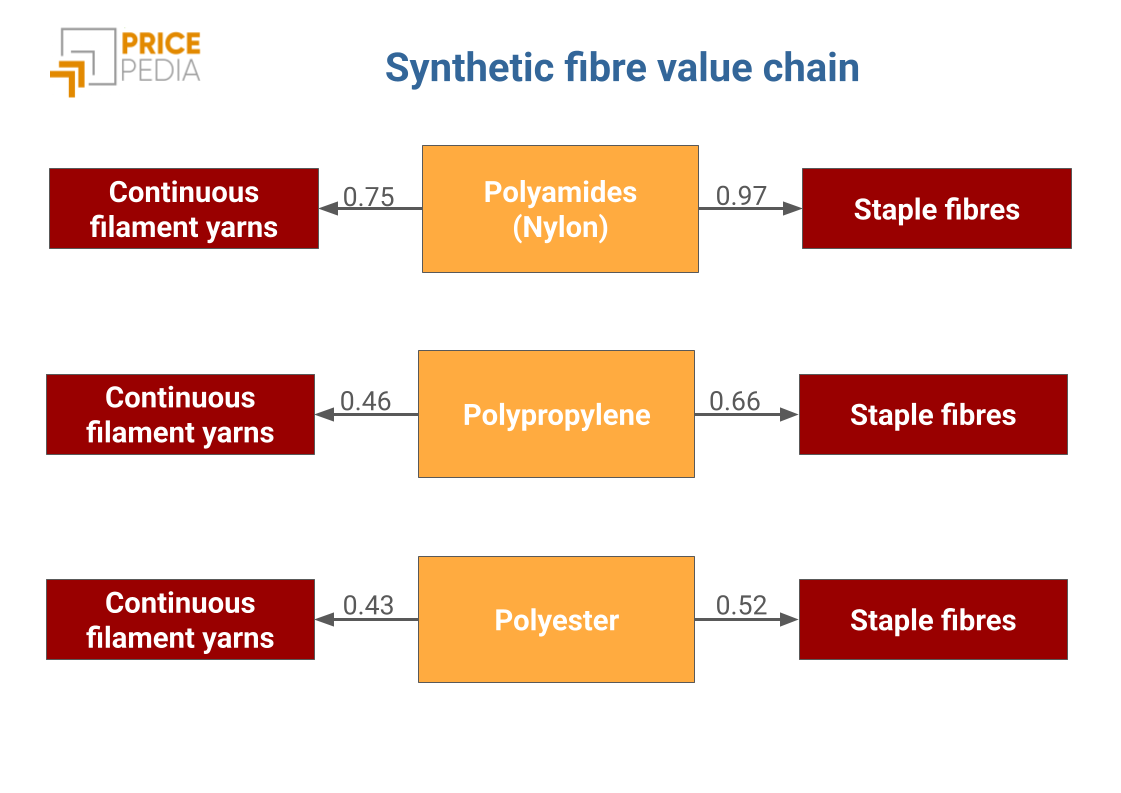
The estimated long-run elasticities highlight the relationship between prices across the three value chains. Polyamide-based products show the highest values: a 10% increase in the price of nylon is associated, in the long run, with a 9.7% increase in staple fibre prices and a 7.5% increase in continuous-filament yarn prices. Price transmission is more limited in the polypropylene and polyester value chains.
Across all three value chains, staple fibres show greater sensitivity to changes in polymer prices than continuous-filament yarns. This difference may reflect the higher relative incidence of the raw material in the value of fibres, while yarn prices may also incorporate the costs of additional processing and product differentiation, including drawing, texturing, twisting and finishing.
In this respect, further information is provided by the price levels observed for the different products along the value chain. The following table reports prices based on EU customs data, expressed in euro per tonne.
Table 1: Synthetic textile fibres, prices in euro per tonne
| 2022 | 2023 | 2024 | 2025 | 2026* | |
|---|---|---|---|---|---|
| Polyamides | |||||
| D-Last Price EU-Polyamide (PA) | 3828 | 3178 | 2822 | 2536 | 2626 |
| D-Last Price EU-Nylon staple fibres | 4811 | 4679 | 4267 | 4170 | 4031 |
| D-Last Price EU-Textured filament yarns of nylon > 50 tex | 5523 | 5226 | 4848 | 4667 | 4558 |
| Polypropylene | |||||
| D-Last Price EU-Polypropylene (PP) | 1642 | 1269 | 1304 | 1217 | 1372 |
| D-Last Price EU-Polypropylene staple fibres | 2177 | 1721 | 1728 | 1631 | 1607 |
| D-Last Price EU-Polypropylene textured filament yarn | 2915 | 2930 | 2877 | 2994 | 2819 |
| Polyester | |||||
| D-Last Price EU-Polyethylene terephthalate (PET) | 1528 | 1136 | 1128 | 1040 | 1040 |
| D-Last Price EU-Polyester staple fibres | 1679 | 1445 | 1415 | 1273 | 1252 |
| D-Last Price EU-Textured filament yarn of polyester | 2320 | 1733 | 1878 | 1731 | 1643 |
Among the three value chains considered, nylon records the highest price levels at every stage analysed, followed by polypropylene and polyester.
This differential can be attributed to a combination of the greater complexity of nylon's chemical value chain (see From the physical supply chain to the economic structure of the value chain) and the technical properties that support its use in higher-value applications.
In summary
The analysis shows that shocks affecting polymer prices can be transmitted along synthetic textile fibre value chains with different degrees of intensity, depending on the material and the product's stage of transformation. Among the value chains analysed, nylon shows the strongest relationships, indicating greater long-run sensitivity of downstream product prices to changes in polyamide prices than is observed in the polypropylene and polyester value chains.
Considering the different types of downstream products, staple fibres show a closer relationship with polymer prices than continuous-filament yarns. The latter incorporate additional processing stages that increase the share of conversion costs, thereby reducing the relative weight of the raw material in the formation of the final price.
Do you want to stay up-to-date on commodity market trends?
Sign up for PricePedia newsletter: it's free!
You may be interested in:
PET, Ethylene Glycol and the Strait of Hormuz
Published by Luigi Bidoia. .
Petrolchimica Polyethylene terephthalate (PET) Strait of HormuzIl mercato europeo del PET è in una fase di forte tensione per le richieste di aumento dei produttori [ Read all ]

Recycling Markets and Commodity Markets
Published by Luigi Bidoia. .
Polypropylene Aluminium Polyethylene terephthalate (PET) Circular economyInteractions between scrap prices, recycled commodity prices, and virgin raw material prices [ Read all ]

Cashmere market risk
Published by Luca Sazzini. .
Textile Fibers Wool Price DriversDependence of world cashmere supply on China [ Read all ]