From the 2022-2023 Commodity Cycle to 2026: Insights from Structural Models
Comparing two energy shocks helps identify the commodities most likely to face significant price declines in the months ahead
Published by Luigi Bidoia. .
Organic Chemicals Petrolchimica Strait of HormuzHow the world has changed over the last two weeks
Uncertainty dominates the global economy and international relations, especially since Trump began his second term in office. However, following yesterday's signing of the memorandum of understanding, it is reasonable to hope that the 2026 Iran-US war has been set on a path toward a resolution in the near future.
Financial markets appear to share this expectation, at least judging from the futures curves of the two prices most affected by the recent crisis: Brent crude oil and natural gas traded at the Dutch TTF hub. The charts below compare the futures curves of these two commodities as recorded on June 18, the day the peace agreement between the United States and Iran was signed, and 15 days earlier.
Future price curves for Brent and TTF on 3 and 18 June 2026
| Brent crude oil | Gas TTF |

|

|
The two charts indicate a sharp decline not only in spot prices but also in prices expected over the coming months. This suggests that the price cycle triggered by the US attack on Iran on February 28 may come to an end within a few months.
Even under this scenario, however, the TTF price is not expected to fall below EUR 30/MWh, as it did in the months preceding the attack on Iran by the United States and Israel, but rather to remain slightly above that threshold. Similarly, Brent crude is expected to stay above USD 70 per barrel throughout 2027, without fully returning to the conditions that prevailed before the attack.
Financial markets have therefore incorporated a higher risk premium, which is likely to continue influencing energy commodity prices for a prolonged period.
There is little doubt that several similarities exist between what happened to global prices during the 2022-2023 period and what has occurred, in a more concentrated form, during the current year. Beyond the cyclical dimension, one element common to both shocks is the peak reached by oil prices: USD 118 per barrel on March 31, 2026, compared with USD 124 per barrel on August 8, 2022.
There are, however, significant differences as well. The most striking concerns the peak reached by TTF natural gas prices: EUR 61.9/MWh on March 19, 2026, compared with the extraordinary level of EUR 339/MWh recorded on August 26, 2022.
Another important difference concerns inflation. By mid-2022, inflation had exceeded 9% in the United States, while in the euro area it surpassed 10% by the end of 2022. In contrast, during this year's cycle inflation has risen only slightly above 3% in both regions and is unlikely to exceed 3.5% before beginning a downward trend.
A third difference relates to the strength of global industrial growth. In 2022, supported by the strong post-pandemic recovery of 2021, global industrial production continued to expand at a rate close to 3%. This year, by contrast, global industrial output is unlikely to grow by more than 1.5%.
What will be the effects on commodity markets?
The economic conditions underlying the 2022-2023 commodity price cycle and the 2026 cycle share some common features but also display significant differences. These differences explain the different magnitude of commodity price increases, which reached peak annual growth rates of approximately 70% and 15%, respectively. The similarities, on the other hand, support expectations of a decline in prices in the near future, following a pattern similar to that observed during the 2022-2023 cycle.
Since the maximum decline recorded in mid-2023 was close to 30% year-on-year, a simple comparison suggests that average commodity prices could experience a decline of at least 5% on an annual basis in the coming months.
However, it is difficult to derive more detailed information regarding both the timing of this potential downturn and the products most likely to be affected. In this context, structural models represent a particularly valuable tool because they make it possible to analyze how changes in the economic and geopolitical environment are transmitted across different markets.
Assuming that the relationships observed between energy prices, industrial activity, inflation, and commodity prices during the 2022-2023 cycle may reappear, at least partially, in the cycle that began in 2026, it becomes possible to formulate hypotheses about the likely evolution of markets in the coming months.
What a structural model suggests
Applying a structural model to current market conditions provides a number of preliminary indications. If the relationships observed during the 2022-2023 cycle were to re-emerge, the prices most exposed to a future downward adjustment would likely be those that recorded the strongest increases during the recent energy shock.
These include a wide range of products within the chemical value chain, particularly thermoplastic polymers, hydrocarbons, and the alcohols derived from them. These product families benefited the most from rising energy prices and could therefore be among the most sensitive to a reversal of those trends.
Year-on-Year (%) Changes in European Chemical Commodity Price Indices in 2026
| Index | 2026-01 | 2026-02 | 2026-03 | 2026-04 | 2026-05 |
|---|---|---|---|---|---|
| Thermoplastic Polymers Index (Europe) | 2.35 | 0.57 | 2.31 | 12.06 | 16.86 |
| Hydrocarbons Index (Europe) | -2.09 | 2.81 | 2.97 | 8.23 | 7.94 |
| Alcohols Index (Europe) | -0.88 | 0.25 | 0.00 | 1.16 | 11.59 |
The magnitude and timing of any price declines will nevertheless depend on the evolution of the geopolitical environment, the speed at which energy markets absorb the risk premium accumulated in recent months, and the performance of the global economy during the second half of the year.
During the first week of July, PricePedia will publish a new forecasting scenario based on an updated version of its structural model, providing quantitative indications regarding the markets and commodities that could be most affected by a future phase of price declines.
You may be interested in:
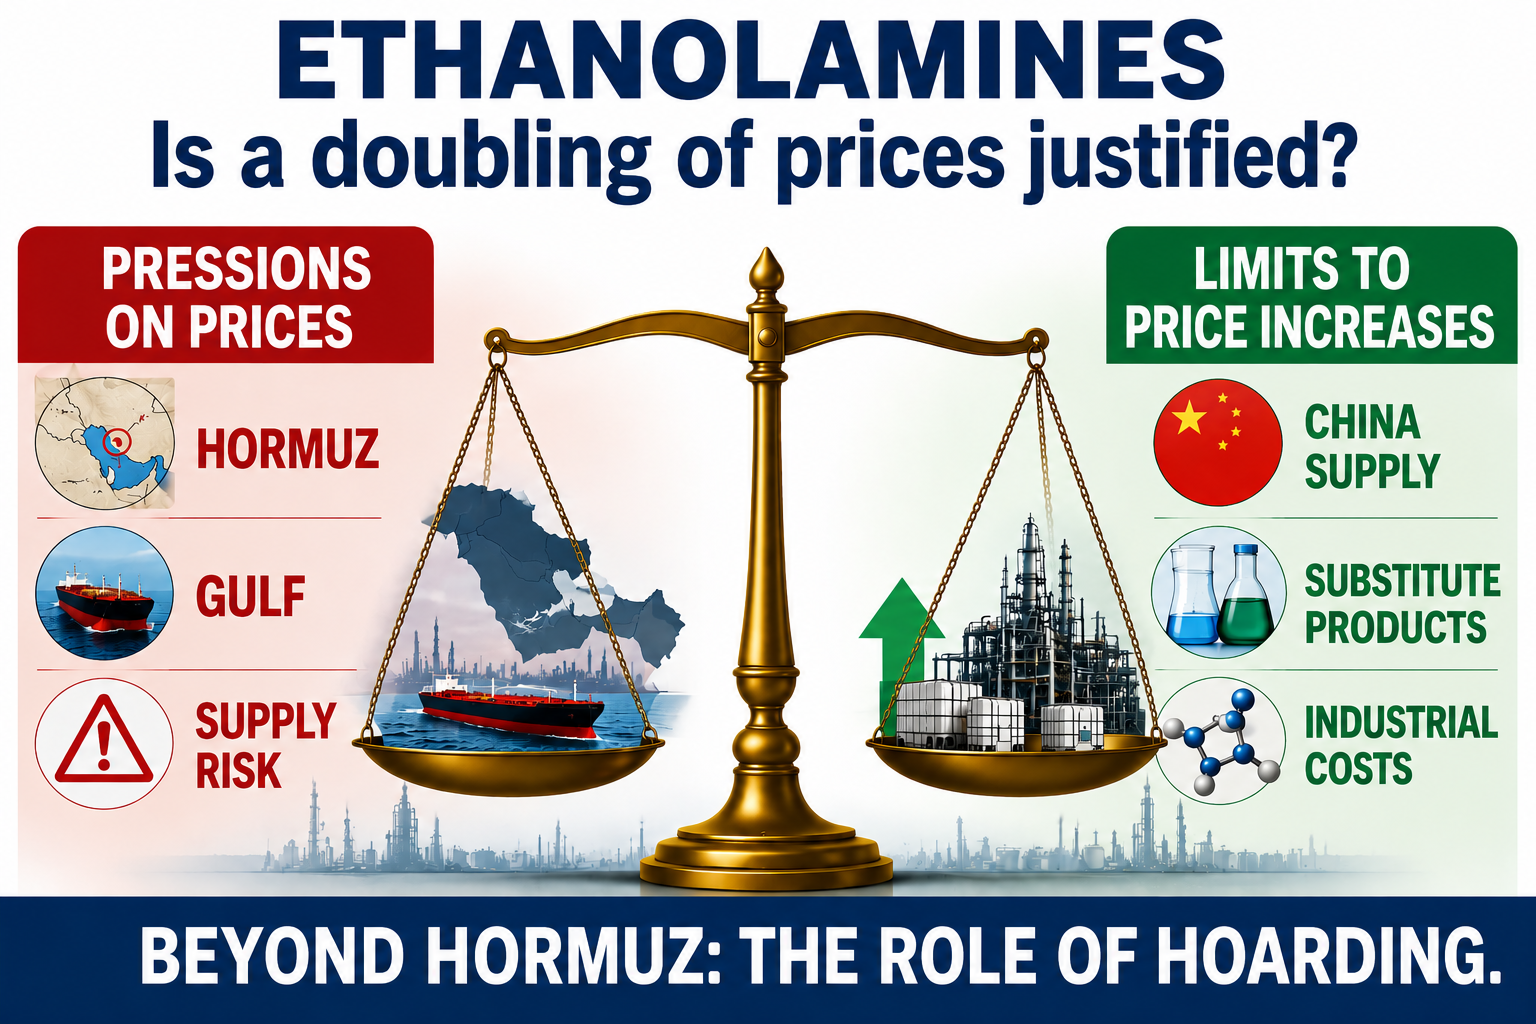
Ethanolamines: Between Market Fundamentals and Supply Concerns
Published by Daniel Vito Lobasso. .
Petrolchimica economic analysis Strait of HormuzGli aumenti di prezzo sono realmente giustificati dal rischio di blocco dello Stretto di Hormuz? [ Read all ]
From the Physical Supply Chain to the Economic Structure of the Value Chain
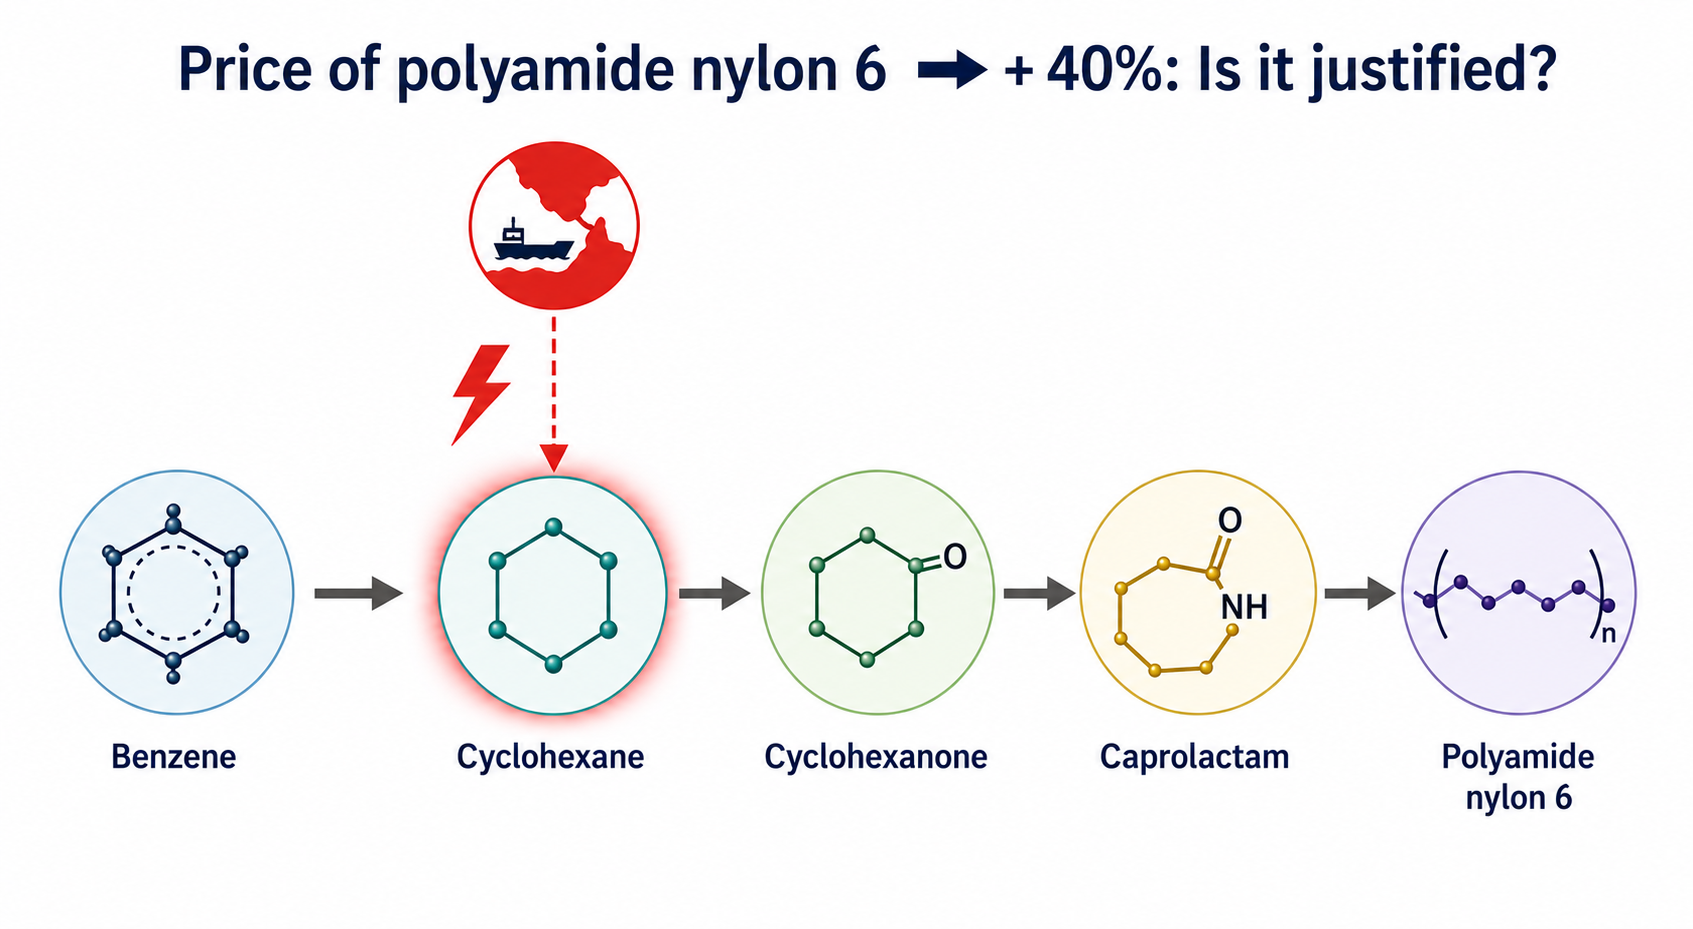
Published by Luigi Bidoia. .
Organic Chemicals Petrolchimica Strait of HormuzL'impatto della chiusura dello Stretto di Hormuz sulla filiera benzene-nylon [ Read all ]
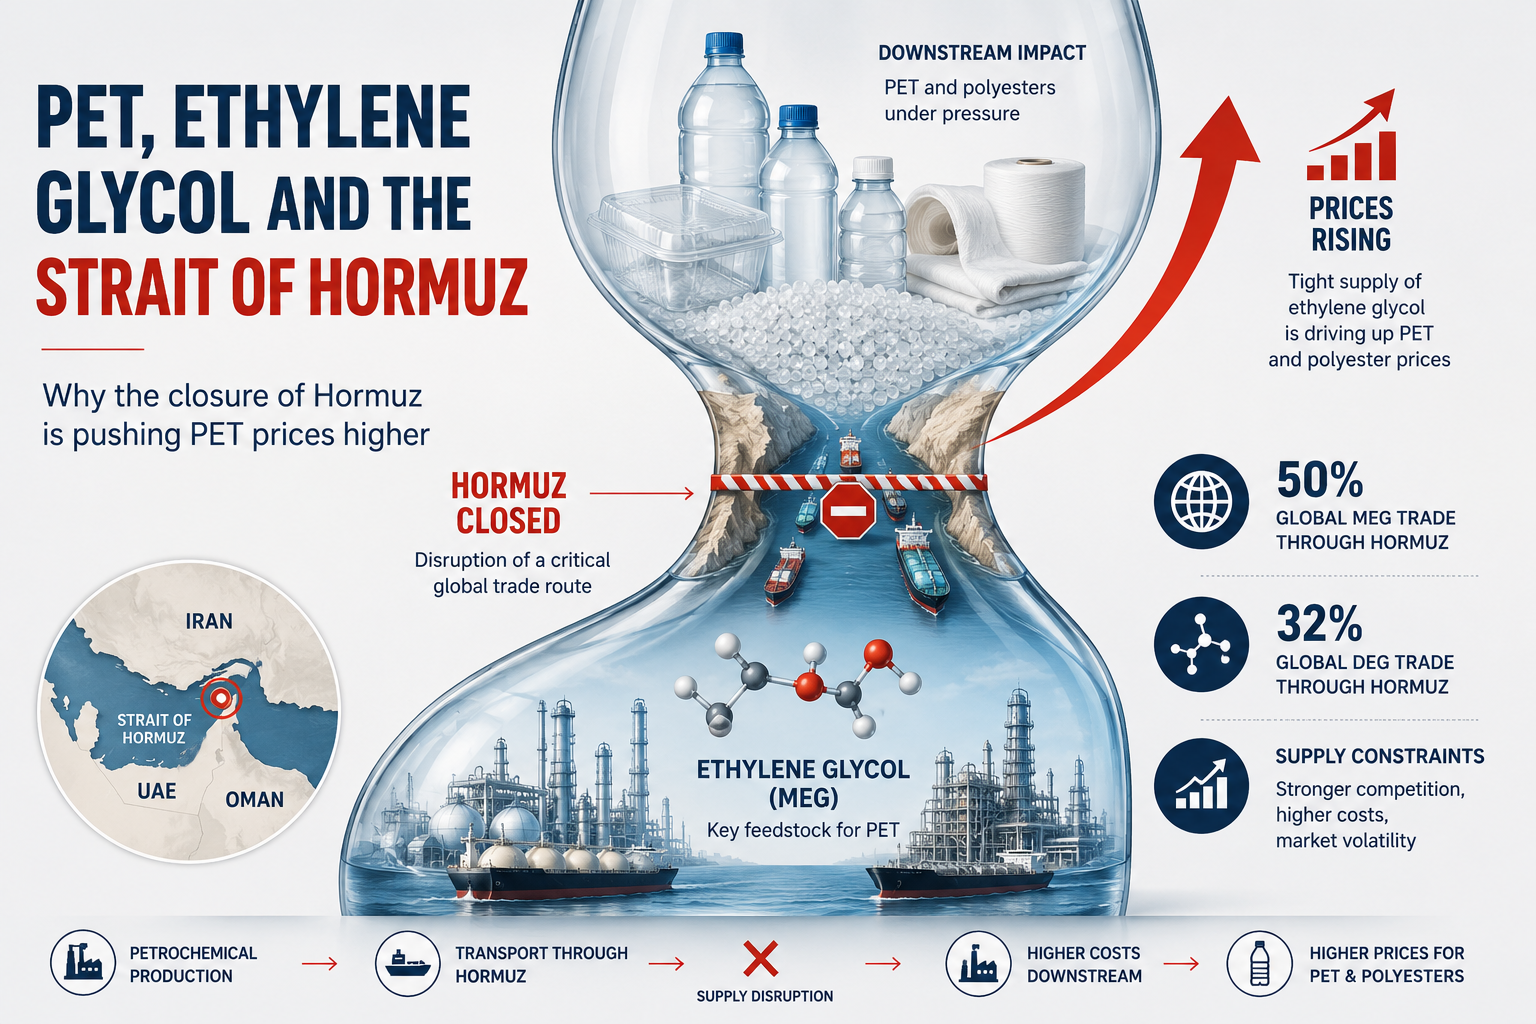
PET, Ethylene Glycol and the Strait of Hormuz
Published by Luigi Bidoia. .
Petrolchimica Polyethylene terephthalate (PET) Strait of HormuzIl mercato europeo del PET è in una fase di forte tensione per le richieste di aumento dei produttori [ Read all ]