Cost pass-through of stainless steel wire rod prices
Which factors have the greatest impact on the price?
Published by Luca Sazzini. .
Stainless Steel Wirerod Cost pass-through
Stainless steel wire rod differs from carbon steel wire rod due to its higher chromium content, which provides greater resistance to corrosion and high-temperature oxidation. Depending on their alloy composition, stainless steels are mainly classified into two families: austenitic and ferritic. In addition to chromium, the former are characterized by significant nickel content, whereas the latter contain no nickel or only very limited amounts.
The addition of chromium and, where applicable, nickel significantly alters the cost structure of wire rod, affecting not only its price level but also its price dynamics over time.
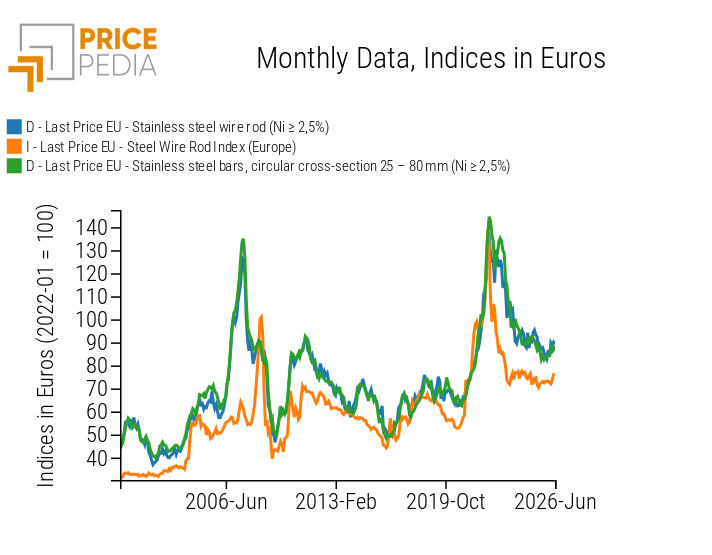
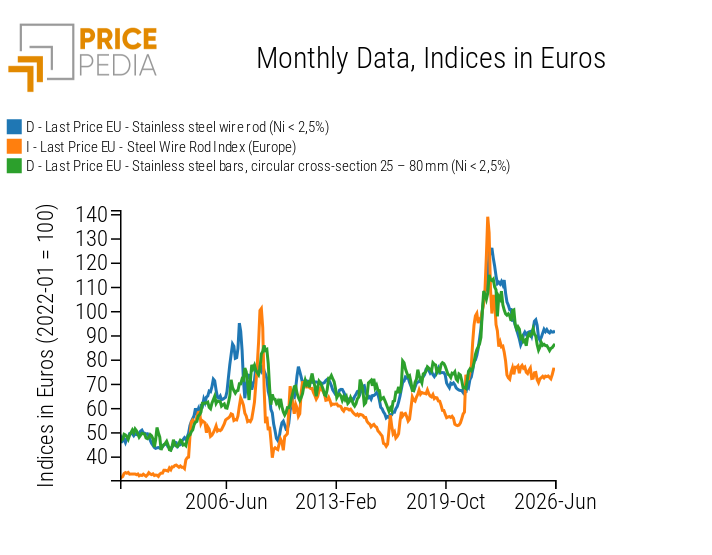
The following two charts compare stainless steel wire rod prices with the European carbon steel wire rod price index and stainless steel bar prices.
| Comparison between customs prices of stainless steel wire rod and stainless steel bars | |
| Austenitic stainless steel | Ferritic stainless steel |
|
|
The two charts show that the prices of both types of stainless steel wire rod are more closely linked to stainless steel bar prices than to carbon steel wire rod prices. This suggests that, similarly to what was demonstrated for stainless steel coil prices in the article Cost pass-through of hot-rolled austenitic coil prices
, stainless steel wire rod prices are also more sensitive to changes in the alloy surcharge than to fluctuations in steel prices.
To verify this hypothesis, the cost pass-through of both austenitic and ferritic stainless steel wire rod prices will be analyzed through two regression models based on the costs of their respective production inputs.
Regression Models
The regression models used to estimate the cost pass-through of stainless steel wire rod are both based on the same theoretical framework.
The dependent variables are, respectively, the prices of austenitic and ferritic stainless steel wire rod, while the explanatory variables are:
- the electric arc furnace steel charge cost index, which incorporates both the cost of steel scrap and the electricity required for the melting process;
- the alloy surcharge price: the price of the AISI 304 alloy surcharge was used for the austenitic stainless steel wire rod model, while the AISI 430 alloy surcharge was used for the ferritic stainless steel wire rod model;
- the Euro Area Consumer Price Index (CPI), used as a proxy for labor and service costs involved in the production process, under the assumption that both are indexed to inflation.
A two-period lag was introduced for the explanatory variables related to production inputs, namely the steel charge and the alloy surcharge, in order to account for the time required for changes in these costs to be transmitted to stainless steel wire rod prices.
For both models, the Engle-Granger approach was adopted, allowing the dynamic specification to be estimated in two separate stages. In the first stage, an OLS regression is estimated to identify the long-run equilibrium relationship among the variables. In the second stage, an Error Correction Model (ECM) is applied to analyze the short-run adjustment process of the variables following deviations from the long-run equilibrium relationship identified in the first stage.
For both the austenitic and ferritic stainless steel wire rod models, all variables were transformed into logarithms, allowing the estimated coefficients to be interpreted as elasticities.
Long-Run Estimates
The table below reports the long-run estimation results for stainless steel wire rod prices.
Long-run estimation results for stainless steel wire rod prices
| Long-run equation regressors | Adjusted R² | |||
|---|---|---|---|---|
| Electric arc furnace steel charge price (-2) | Alloy surcharge price (-2) | Euro Area Consumer Price Index | ||
| Austenitic stainless steel wire rod price | 0.21 | 0.54 | 0.36 | 0.94 |
| Ferritic stainless steel wire rod price | 0.13 | 0.42 | 0.22 | 0.92 |
All long-run coefficients are consistent with theoretical expectations and are statistically significant.
The estimated cost pass-through of the alloy surcharge is 0.54 for austenitic wire rod and 0.42 for ferritic wire rod. In both cases, these values are more than twice and more than three times higher, respectively, than the cost pass-through associated with the electric arc furnace steel charge. This confirms the hypothesis that stainless steel wire rod prices are primarily driven by the dynamics of the alloy surcharge component. In particular, ceteris paribus, a 10% increase (decrease) in alloy surcharge prices leads, on average, to a 5.4% increase (decrease) in the price of austenitic stainless steel wire rod and a 4.2% increase (decrease) in the price of ferritic stainless steel wire rod.
The adjusted R² values of the two models are 0.94 and 0.92, respectively, indicating that the explanatory variables account for more than 90% of the long-run variation in stainless steel wire rod prices.
Short-Run Estimates
To analyze the short-run adjustment process of stainless steel wire rod prices, the estimation results obtained by applying the Error Correction Model (ECM) to the previously estimated long-run relationships are reported below.
Short-run estimation results for stainless steel wire rod prices
| Impact Effect | Adjustment Coefficient | Adjusted R2 | |
|---|---|---|---|
| Austenitic stainless steel wire rod | 0.22 | -0.41 | 0.39 |
| Ferritic stainless steel wire rod | 0.37 | -0.16 | 0.32 |
Once again, all estimated coefficients are highly statistically significant.
The impact effect coefficient is higher for ferritic stainless steel wire rod than for austenitic wire rod, with an estimated value of 0.37. This indicates that 37% of the changes in the price determinants are transmitted immediately to the price of ferritic stainless steel wire rod.
The adjustment coefficient, on the other hand, is larger in absolute value for austenitic stainless steel wire rod (0.41), indicating a faster correction toward the long-run equilibrium. Specifically, in each period, 41% of the gap between the observed price and its theoretical long-run equilibrium value is eliminated.
Conclusions
The analysis of historical price series shows that stainless steel wire rod prices are more closely correlated with the price dynamics of stainless steel products than with those of carbon steel wire rod. The regression models further confirm this evidence, estimating a significantly higher cost pass-through from the alloy surcharge to stainless steel wire rod prices than from the other production inputs considered. These findings highlight that monitoring the prices of the specific alloy surcharge components used in production is essential for understanding and anticipating the evolution of stainless steel wire rod prices.
You may be interested in:

Brass and stainless steel in plumbing fittings
Published by Luca Sazzini. .
Stainless Steel Brass Analysis tools and methodologiesIs there a process underway to replace the inputs for plumbing fittings? [ Read all ]
Analysis of the effects of trade barriers on wire rod prices
Published by Luca Sazzini. .
Wirerod EU customs duties USA customs duties Import tariffsWire rod: price gap between China, EU and US widens due to tariffs [ Read all ]
Ferritic coils: the cost pass-through of input prices
Published by Luca Sazzini. .
Ferrous Metals Stainless Steel Cost pass-throughPrices of extralega and steel charge have similar effects [ Read all ]