A mixed picture for financial commodity prices
Commodity markets amid geopolitical tensions, inflation, and supply shortages
Published by Luca Sazzini. .
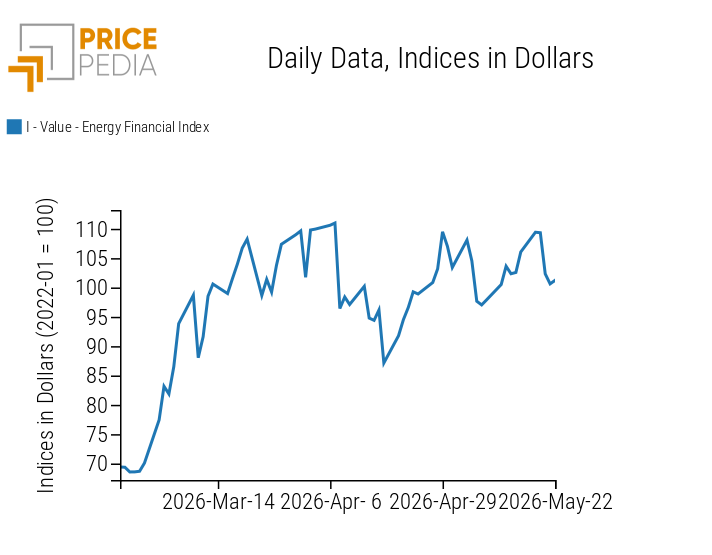
Conjunctural Indicators Commodities Financial WeekIn last week’s article: “What factors are influencing commodity prices in the financial markets?” the main drivers of commodity financial markets over recent months were analyzed. Also this week, these factors have continued to drive price performance, with the energy sector confirming itself as the most volatile, influenced by the evolving conflict in the Persian Gulf and news related to negotiations on the Strait of Hormuz.
In this context, the encouraging news that emerged in recent days led to a decline in Brent prices, which nevertheless remain above the $100 per barrel threshold. High uncertainty persists, particularly regarding uranium enrichment and the related stocks held by Tehran. The United States is calling for these stocks to be transferred outside the country, but Iran does not appear willing to accept this condition.
An additional source of tension concerns the management of the Strait of Hormuz, where Tehran is trying to strengthen control over maritime transit, including through requests for payments or authorizations for ship passage. The prospect of Iran exercising direct control over one of the world’s main energy “choke points” is considered unacceptable by the United States, as it could affect freedom of navigation and global energy balances. Until an agreement is reached on at least this key point, a significant correction in oil prices is unlikely.
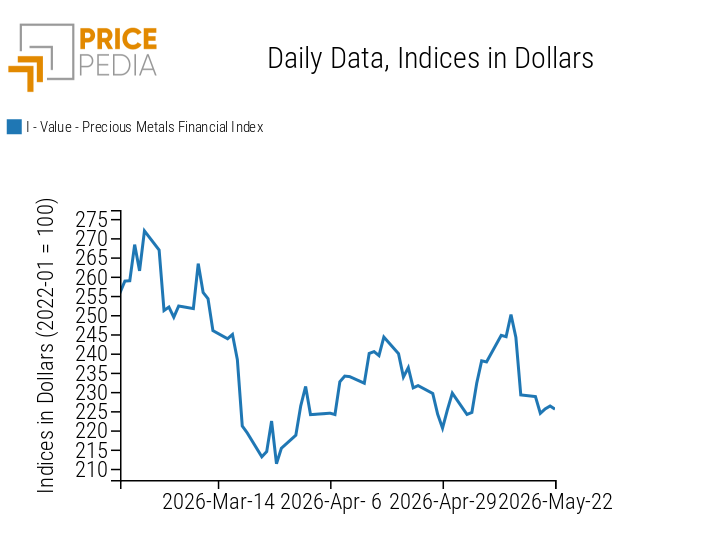
The precious metals market, while remaining supported by expectations of still-solid gold demand from central banks, recorded a correction following the release of new inflation data in Europe and the United States last week, which showed an increase compared to the previous month and levels significantly above the respective central bank targets.
Concerns about a more restrictive monetary policy stance are increasing the opportunity cost of safe-haven assets relative to bonds, thus leading to a correction in precious metals prices. Silver, the most volatile metal in the segment, experienced the sharpest decline, falling to around $75/oz. Gold, on the other hand, showed greater resilience, remaining above $4500/oz.
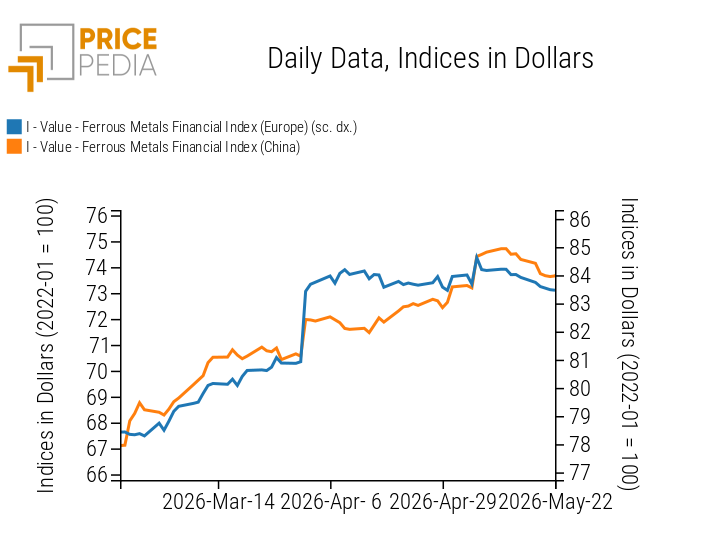
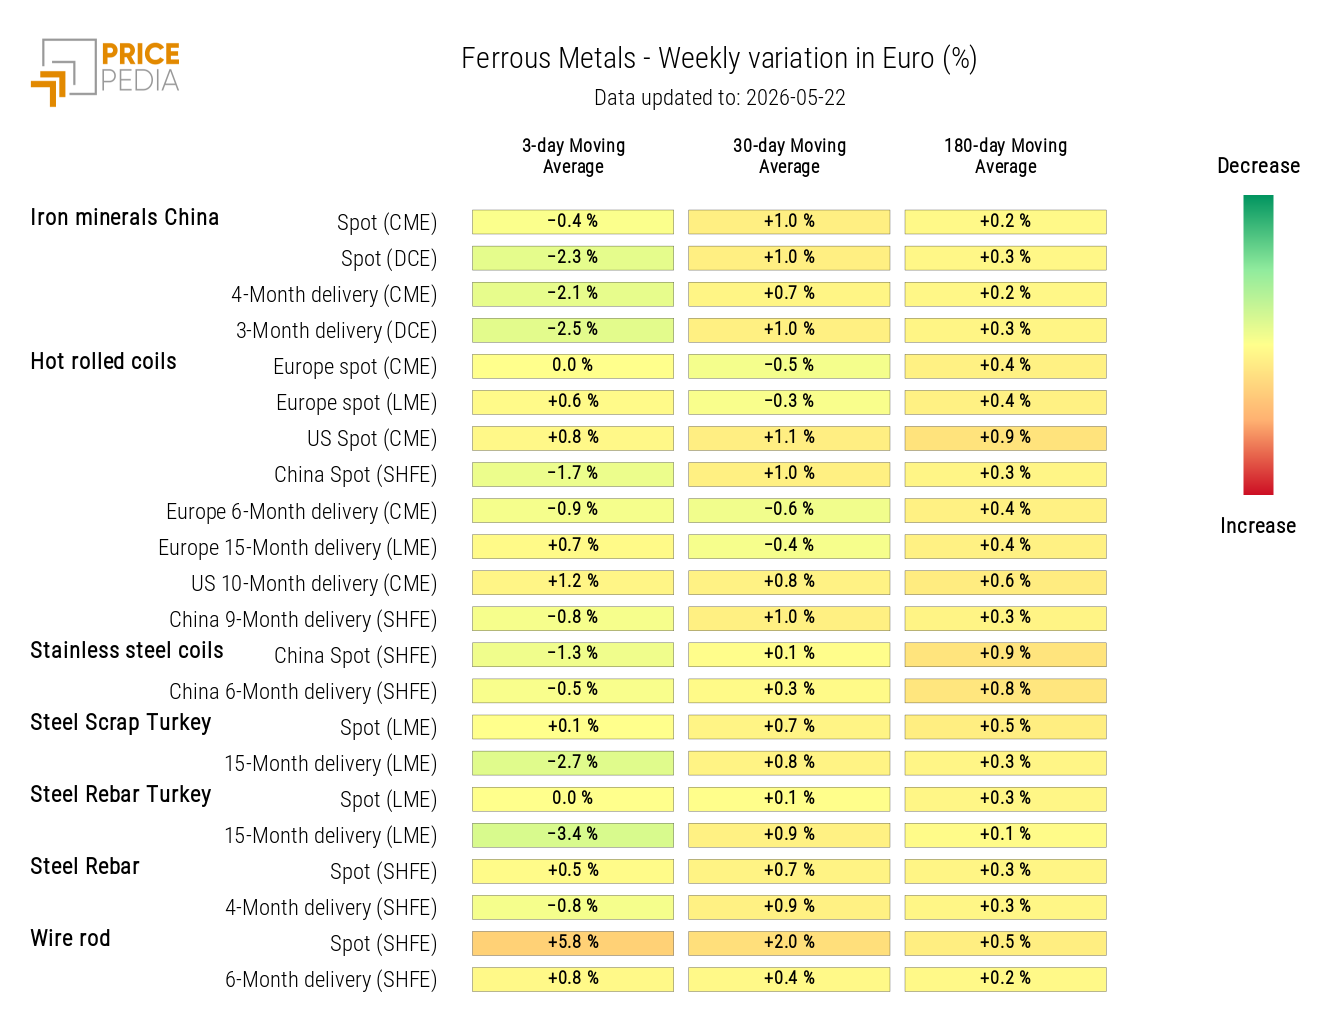
In the industrial metals sector, slight weekly price fluctuations are recorded, which should not interrupt the underlying upward trend, supported by the energy transition, rearmament, and increasing demand for non-ferrous metals linked to the development of infrastructure required for artificial intelligence data centers. Among ferrous metals, a slight weekly decline is observed, mainly due to the drop in Chinese iron ore prices.
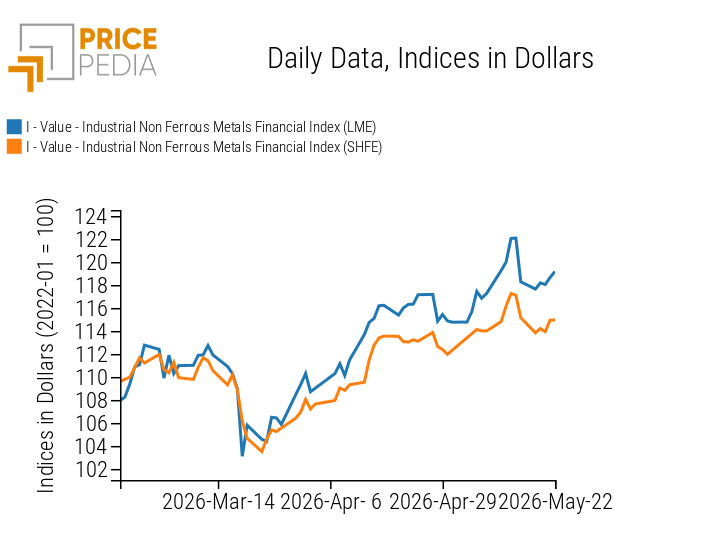
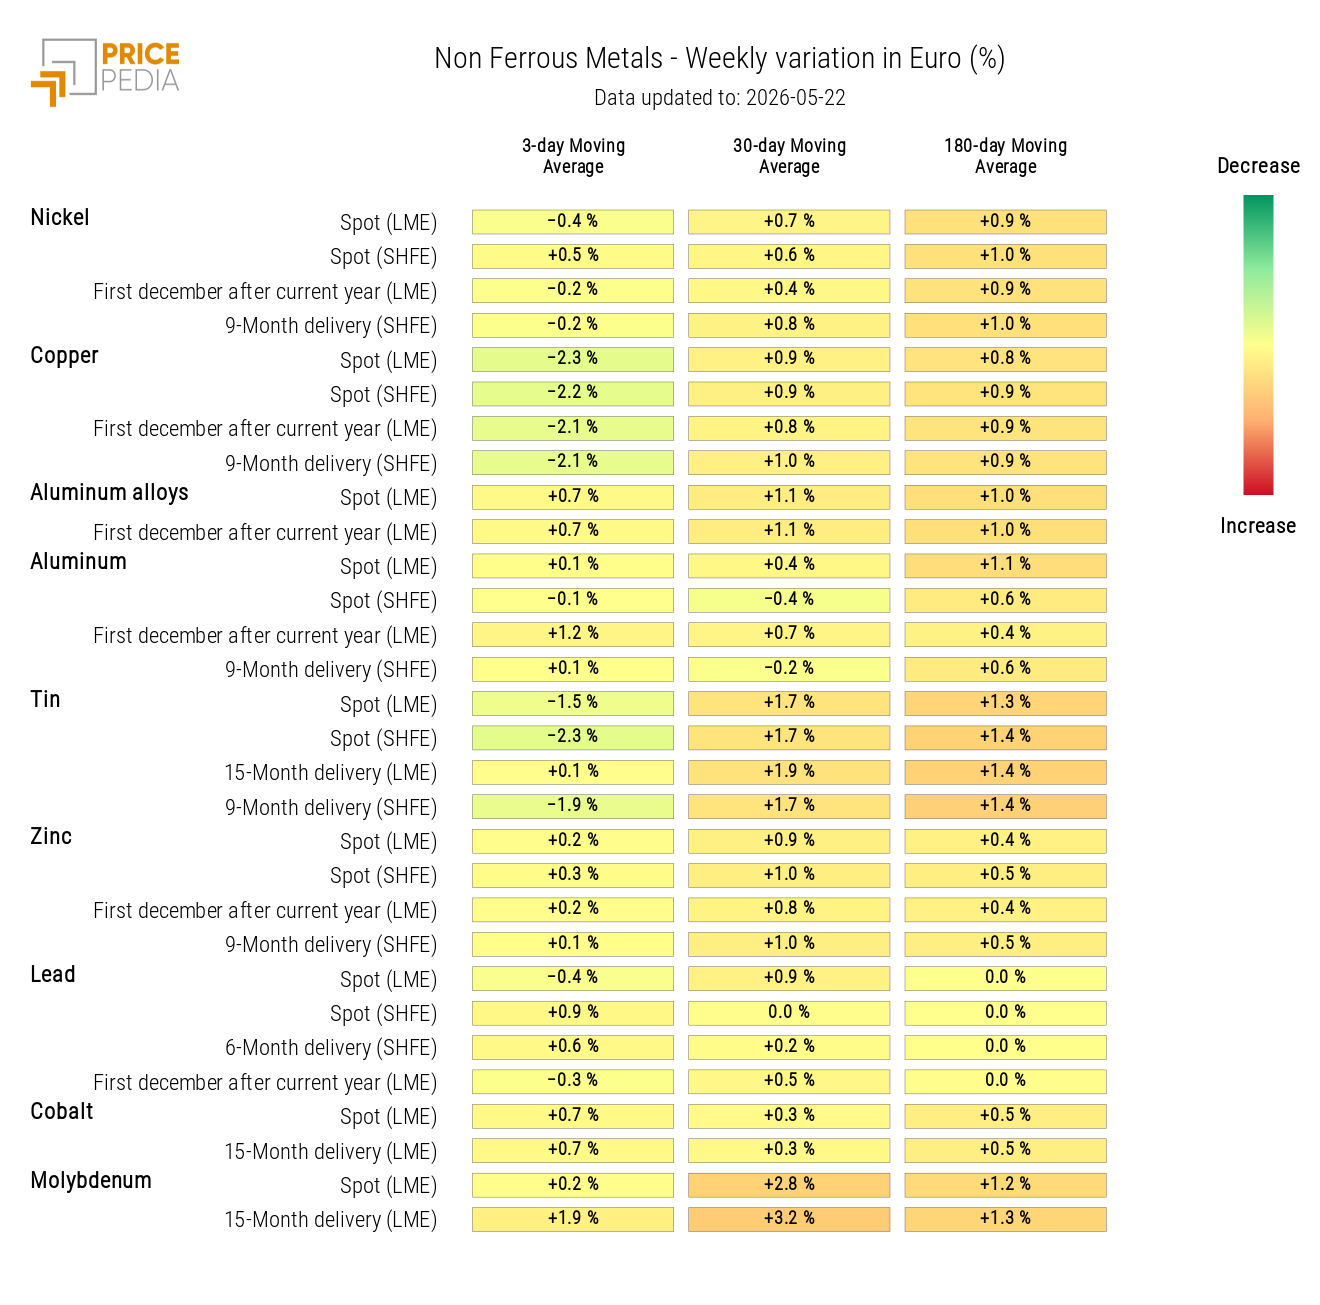
In the non-ferrous segment, greater weekly stability emerges, despite normal market fluctuations. The most significant decline affected copper prices, linked to increased Chinese refined copper production, as shown by data published by the National Bureau of Statistics (NBS). The anomaly highlighted in last week’s article (What factors are influencing commodity prices in the financial markets?) between zinc and aluminium prices also persists, with London Metal Exchange (LME) prices remaining higher than those on the Shanghai Futures Exchange (SHFE), despite the latter incorporating VAT and other taxes. This is due to the current shortage of these metals in LME warehouses.
In the food commodities segment, despite mixed fluctuations, there is a slight weekly increase in prices for cereals and vegetable oils, while tropical products decline, driven by falling prices of cocoa and arabica coffee.
NUMERICAL APPENDIX
ENERGY
The PricePedia financial index of energy products shows continuous changes in direction, linked to the evolving geopolitical escalation in the Persian Gulf.
PricePedia Financial Index of energy prices in US dollars
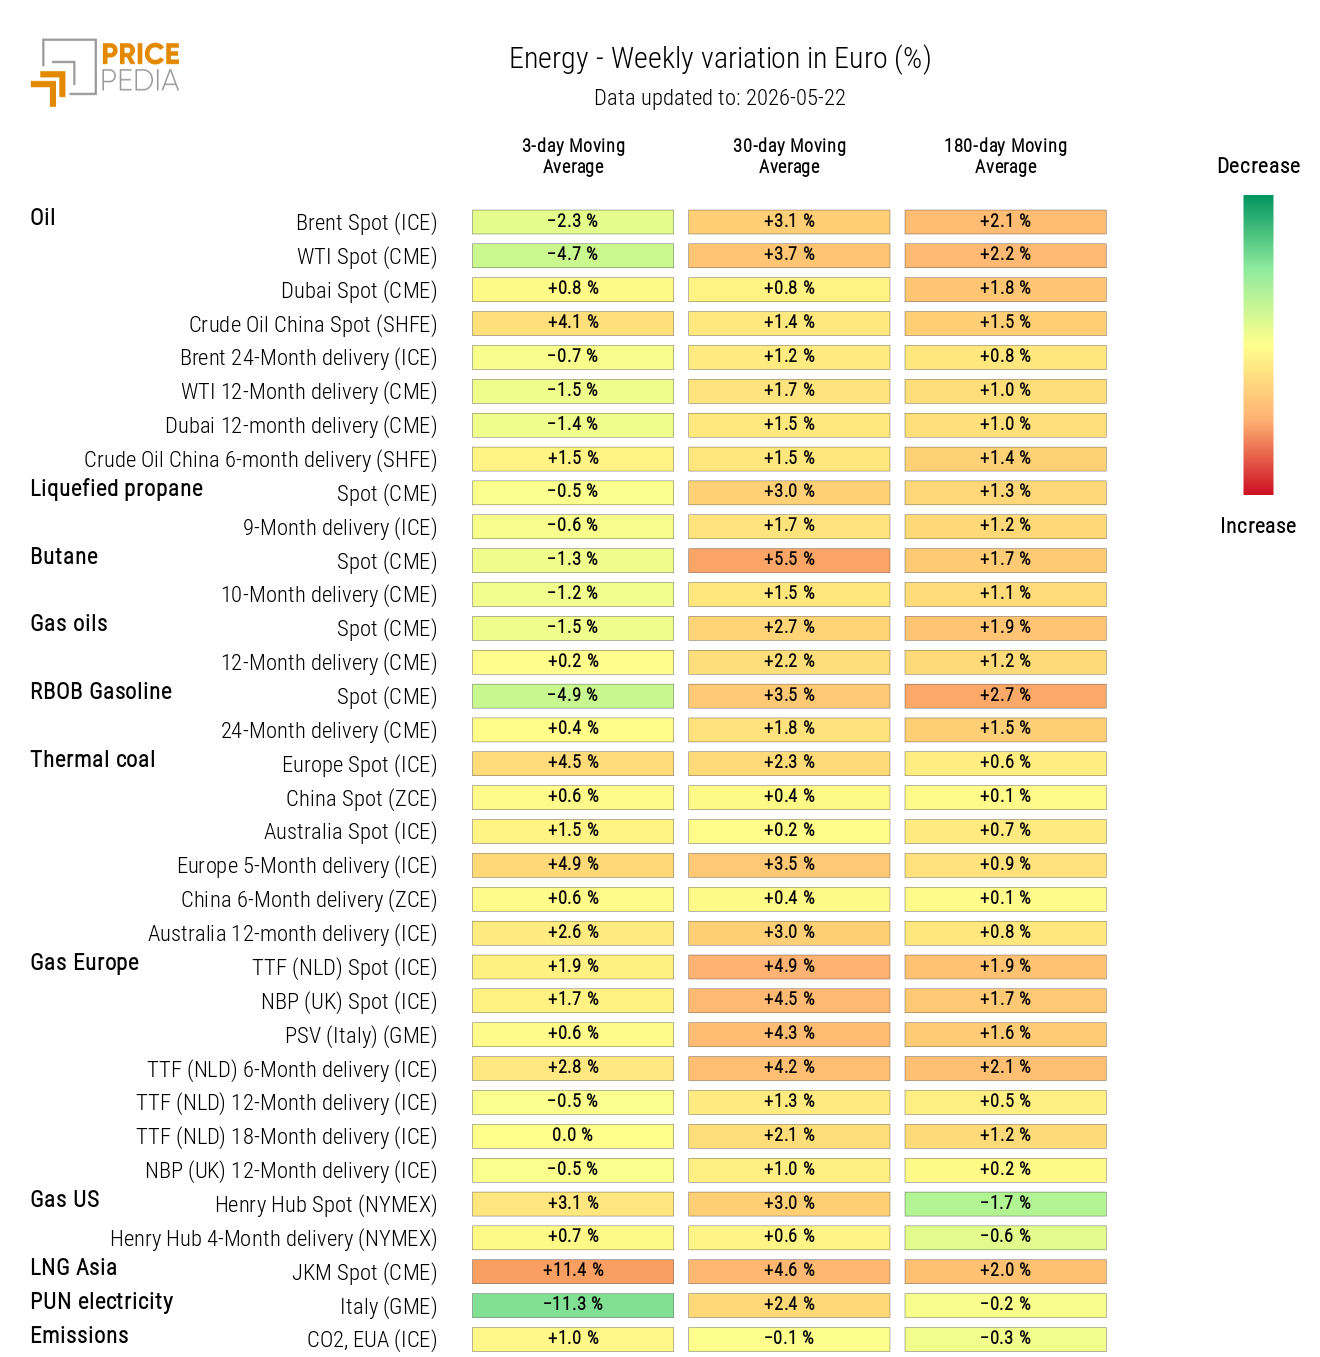
The energy heatmap highlights a weekly decline in the 3-day moving average of oil and gasoline prices.
HeatMap of energy prices in euros
PRECIOUS METALS
The financial index of precious metals shows a price decline, attributable to rising inflationary expectations.
PricePedia Financial Index of precious metals prices in US dollars
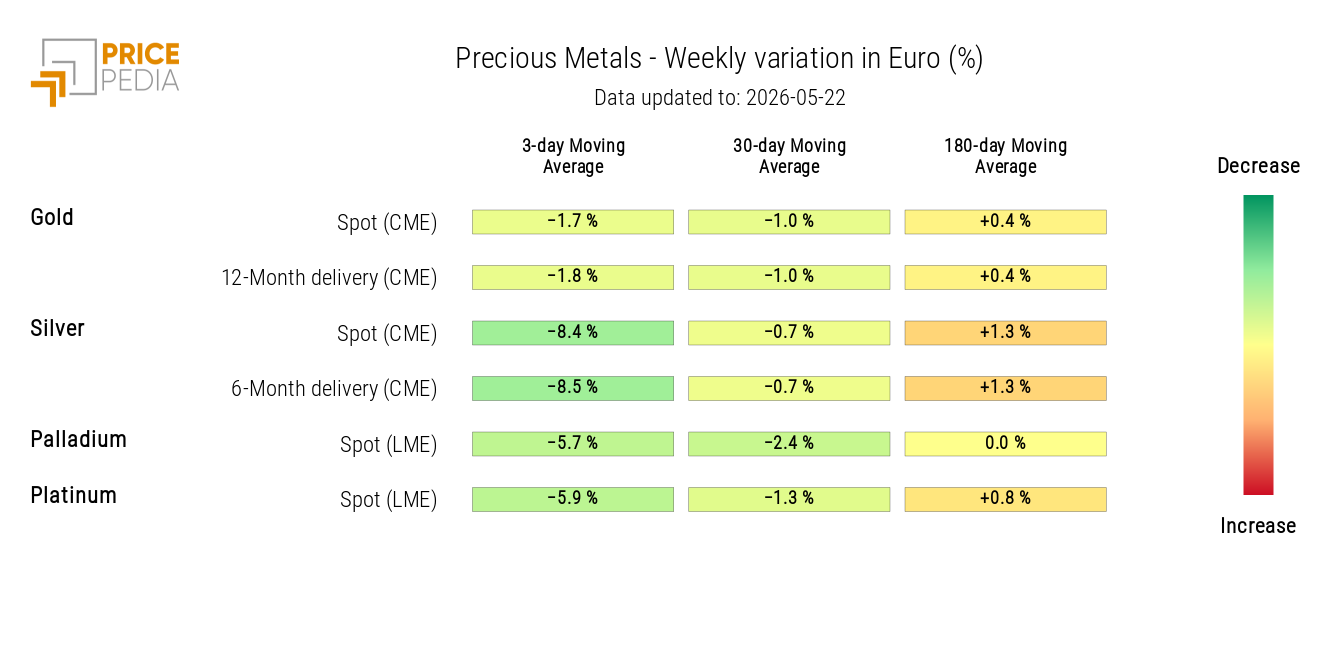
The heatmap analysis shows a broad-based decline in precious metals financial prices.
HeatMap of precious metals prices in euros
FERROUS METALS
Both financial indices for ferrous metals show a slight weekly decline.
PricePedia Financial Indices of ferrous metals prices in US dollars
Heatmap analysis highlights a decline in Chinese iron ore prices, alongside an increase in wire rod prices.
HeatMap of ferrous metals prices in euros
Do you want to stay up-to-date on commodity market trends?
Sign up for PricePedia newsletter: it's free!
NON-FERROUS INDUSTRIAL METALS
Among non-ferrous metals, the decoupling phase between LME and SHFE indices continues.
PricePedia Financial Indices of non-ferrous industrial metals prices in US dollars
Heatmap analysis of non-ferrous metals shows a weekly decline in the moving average of copper and tin prices.
HeatMap of non-ferrous metals prices in euros
FOOD COMMODITIES
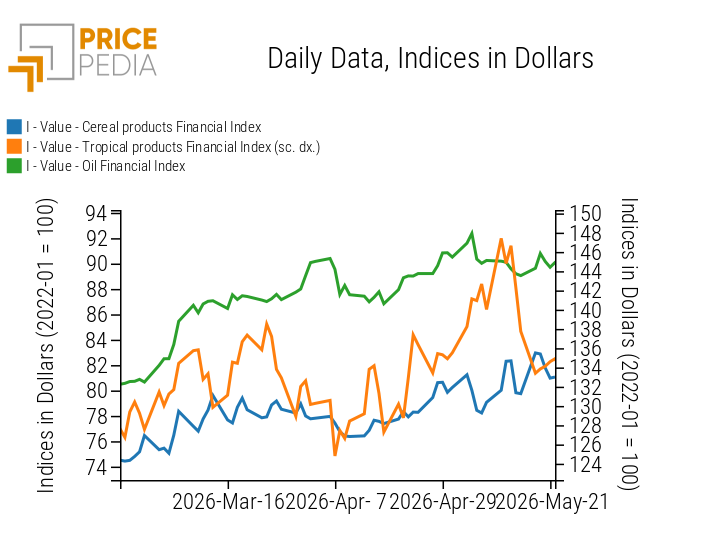
Despite price fluctuations, the tropical index records a weekly decline, while grain and oil indices show a slight increase.
PricePedia Financial Indices of food prices in US dollars
CEREALS
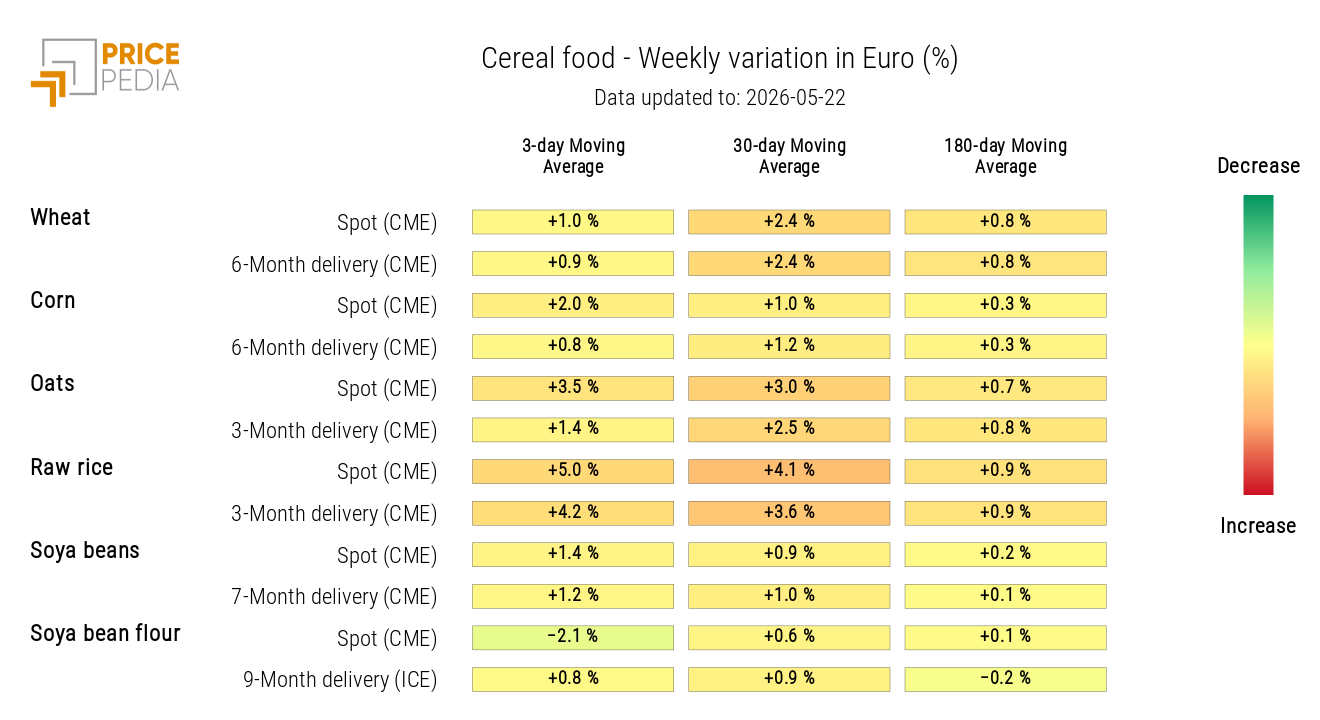
The cereals heatmap shows rising prices for rice, oats, wheat, and corn.
HeatMap of cereal prices in euros
TROPICAL PRODUCTS
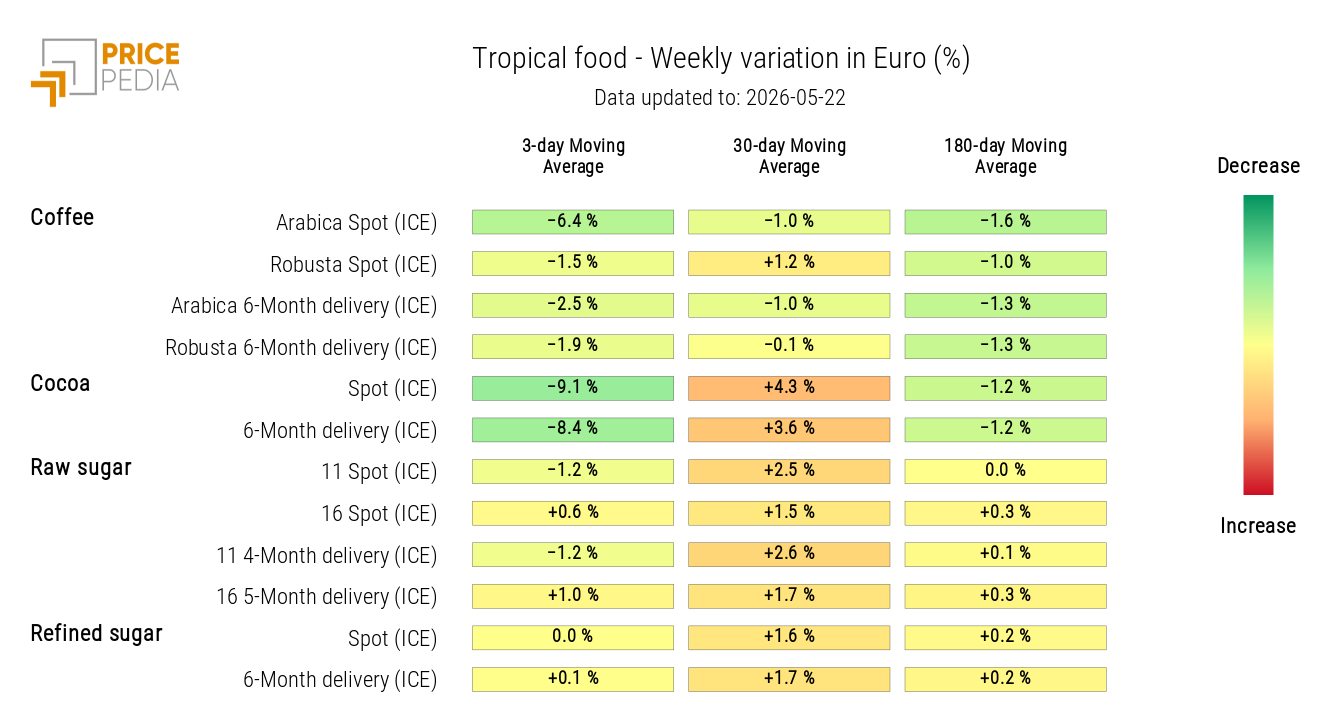
The tropical heatmap shows a weekly decline in arabica coffee and cocoa prices.
HeatMap of tropical food prices in euros
OILS
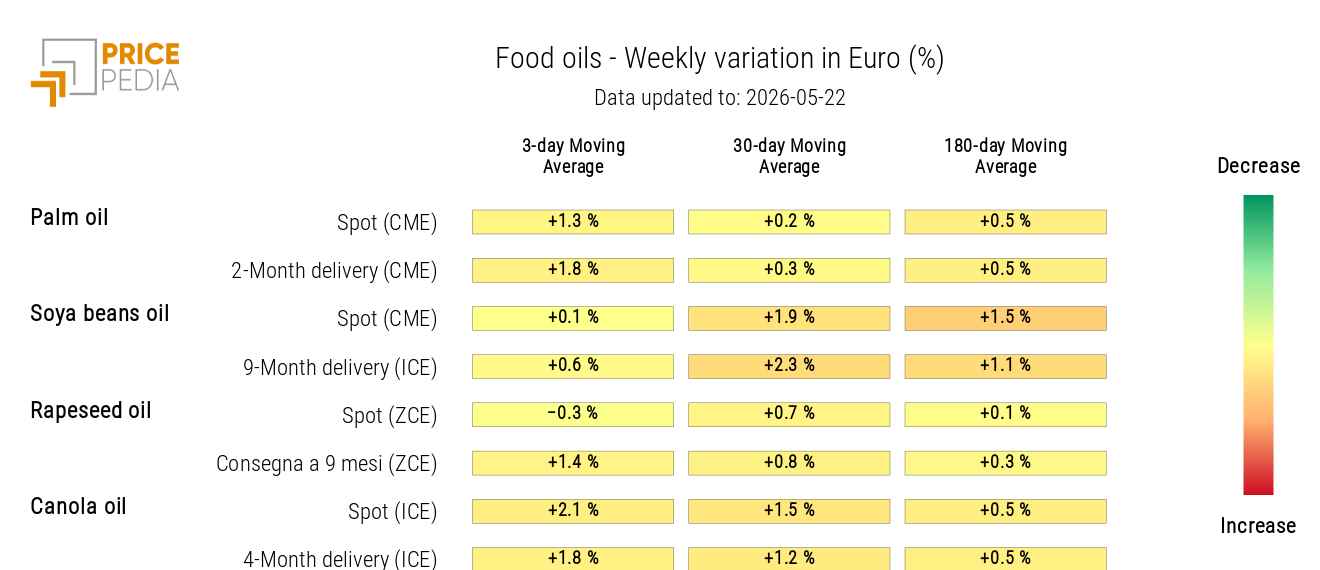
The oils heatmap shows a slight increase in canola oil and palm oil prices.
HeatMap of edible oil prices in euros
You may be interested in:

Expectations of tighter monetary policy are weighing on commodity markets
Published by Luca Sazzini. .
Conjunctural Indicators Commodities Financial WeekThe decline in prices is affecting most sectors [ Read all ]

Commodity markets between supply risks and geopolitical uncertainty
Published by Luca Sazzini. .
Conjunctural Indicators Commodities Financial WeekThe strength of the U.S. economy is bolstering expectations of a more restrictive monetary policy [ Read all ]

China economic update August 2026
Published by Luca Sazzini. .
Conjunctural Indicators Global Economic TrendsIncreased competitive pressure is driving down the prices of Chinese commodities [ Read all ]