In three months, dollar metal prices have risen nearly 25 percent
An overview of current trends in the commodity landscape
Published by Giulio Corazza. .
Energy Ferrous Metals Food Non Ferrous Metals Commodities Financial Week
In the final months of 2022, in the face of rising inflation and lockdowns in China, there was frequent discussion of a slowdown in the world economy, fears of a recession, and a possible widespread decline in financial commodity prices.
However, with the arrival of 2023, what the financial markets expect, already by the end of the year, is a recovery in the global business cycle. These expectations and the depreciation of the dollar exchange rate are behind the current phase of rising commodity prices, especially metals.
The following chart shows the dollar-euro exchange rate. The recent depreciation of the dollar is strong. From the beginning of October
to date the depreciation has exceeded 10 percent. This dynamic should be taken into account when comparing commodity prices expressed in euros.
Dollar euro exchange rate

ENERGY PRODUCTS
OPEC+ members will meet next week to decide on the output target for the next period. According to ING analysts, the output policy is expected to remain unchanged.
Milder period temperatures and the reopening of the U.S. LNG HUB have led to a sharp drop in the price of natural gas listed on the TTF.
The following graph shows the PricePedia financial indices of European and U.S. energy product prices measured in dollars.
Since the beginning of 2023, the U.S. Energy Financial Price Index has been substantially stable. Conversely, that for Europe continues to decline, thanks to lower TTF gas prices.
PricePedia financial indexes of energy prices in Europe and the US in dollars

The heatmap below provides an overview of energy product price trends measured in euros.
At the product level, the situation is differentiated: the price of natural gas shows a clear downward signal, while the
prices of oil and derivatives show more stability.
HeatMap of energy product prices in euros

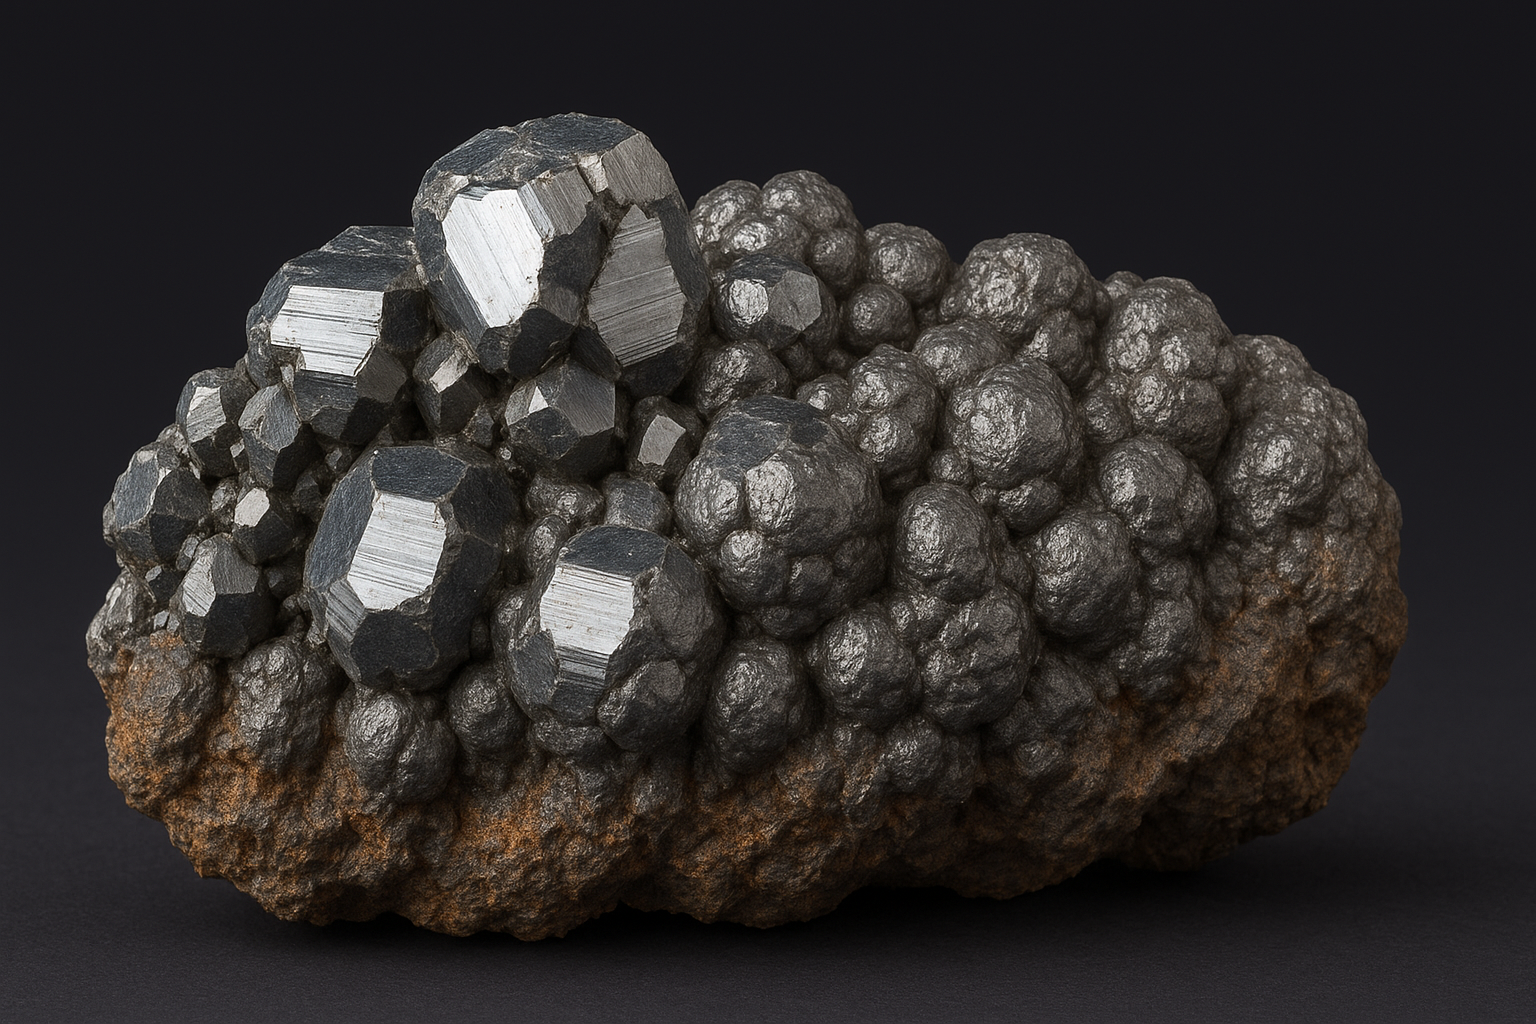
METALS
The following chart shows the PricePedia financial indices of ferrous and nonferrous metals prices measured in dollars. Since the beginning of the year, metals prices have been on an upward path that continues this week. Since the beginning of November 2022 both dollar indices have risen nearly 25 percent.
PricePedia Financial indices of ferrous and nonferrous metals in dollars

FERROUS METALS
The heatmap below provides an overview of ferrous metal price trends measured in euros. Significant is the increase in the price of molybdenum and hot coils in the U.S. market.
HeatMap of ferrous metal prices in euros

NON FERROUS METALS
The heatmap below provides an overview of the price trends of nonferrous metals measured in euros. The increase in tin prices is particularly pronounced.
HeatMap of non-ferrous metal prices in euros

The following graph shows tin prices at the LME for spot and 15-month contracts. In addition to the increase in the spot price, it allows us to highlight the greater growth in the 15-month futures, such that the backwardation phase has closed. Thus, the price increase is not only related to contingent factors, but also reflects market expectations over a one-year horizon and beyond.

FOOD PRODUCTS
The following graph shows the PricePedia financial indexes of food prices measured in dollars. Since the beginning of the year, food prices have shown a roughly stable trend. This week the index for tropical products shows an increase. On the other hand, the index for farm food products is stable.
PricePedia Financial Indices of Food Products in Dollars

The heatmap below provides an overview of tropical food price trends. Particularly pronounced is the increase in arabica coffee prices.
HeatMap of tropical food prices

You may be interested in:

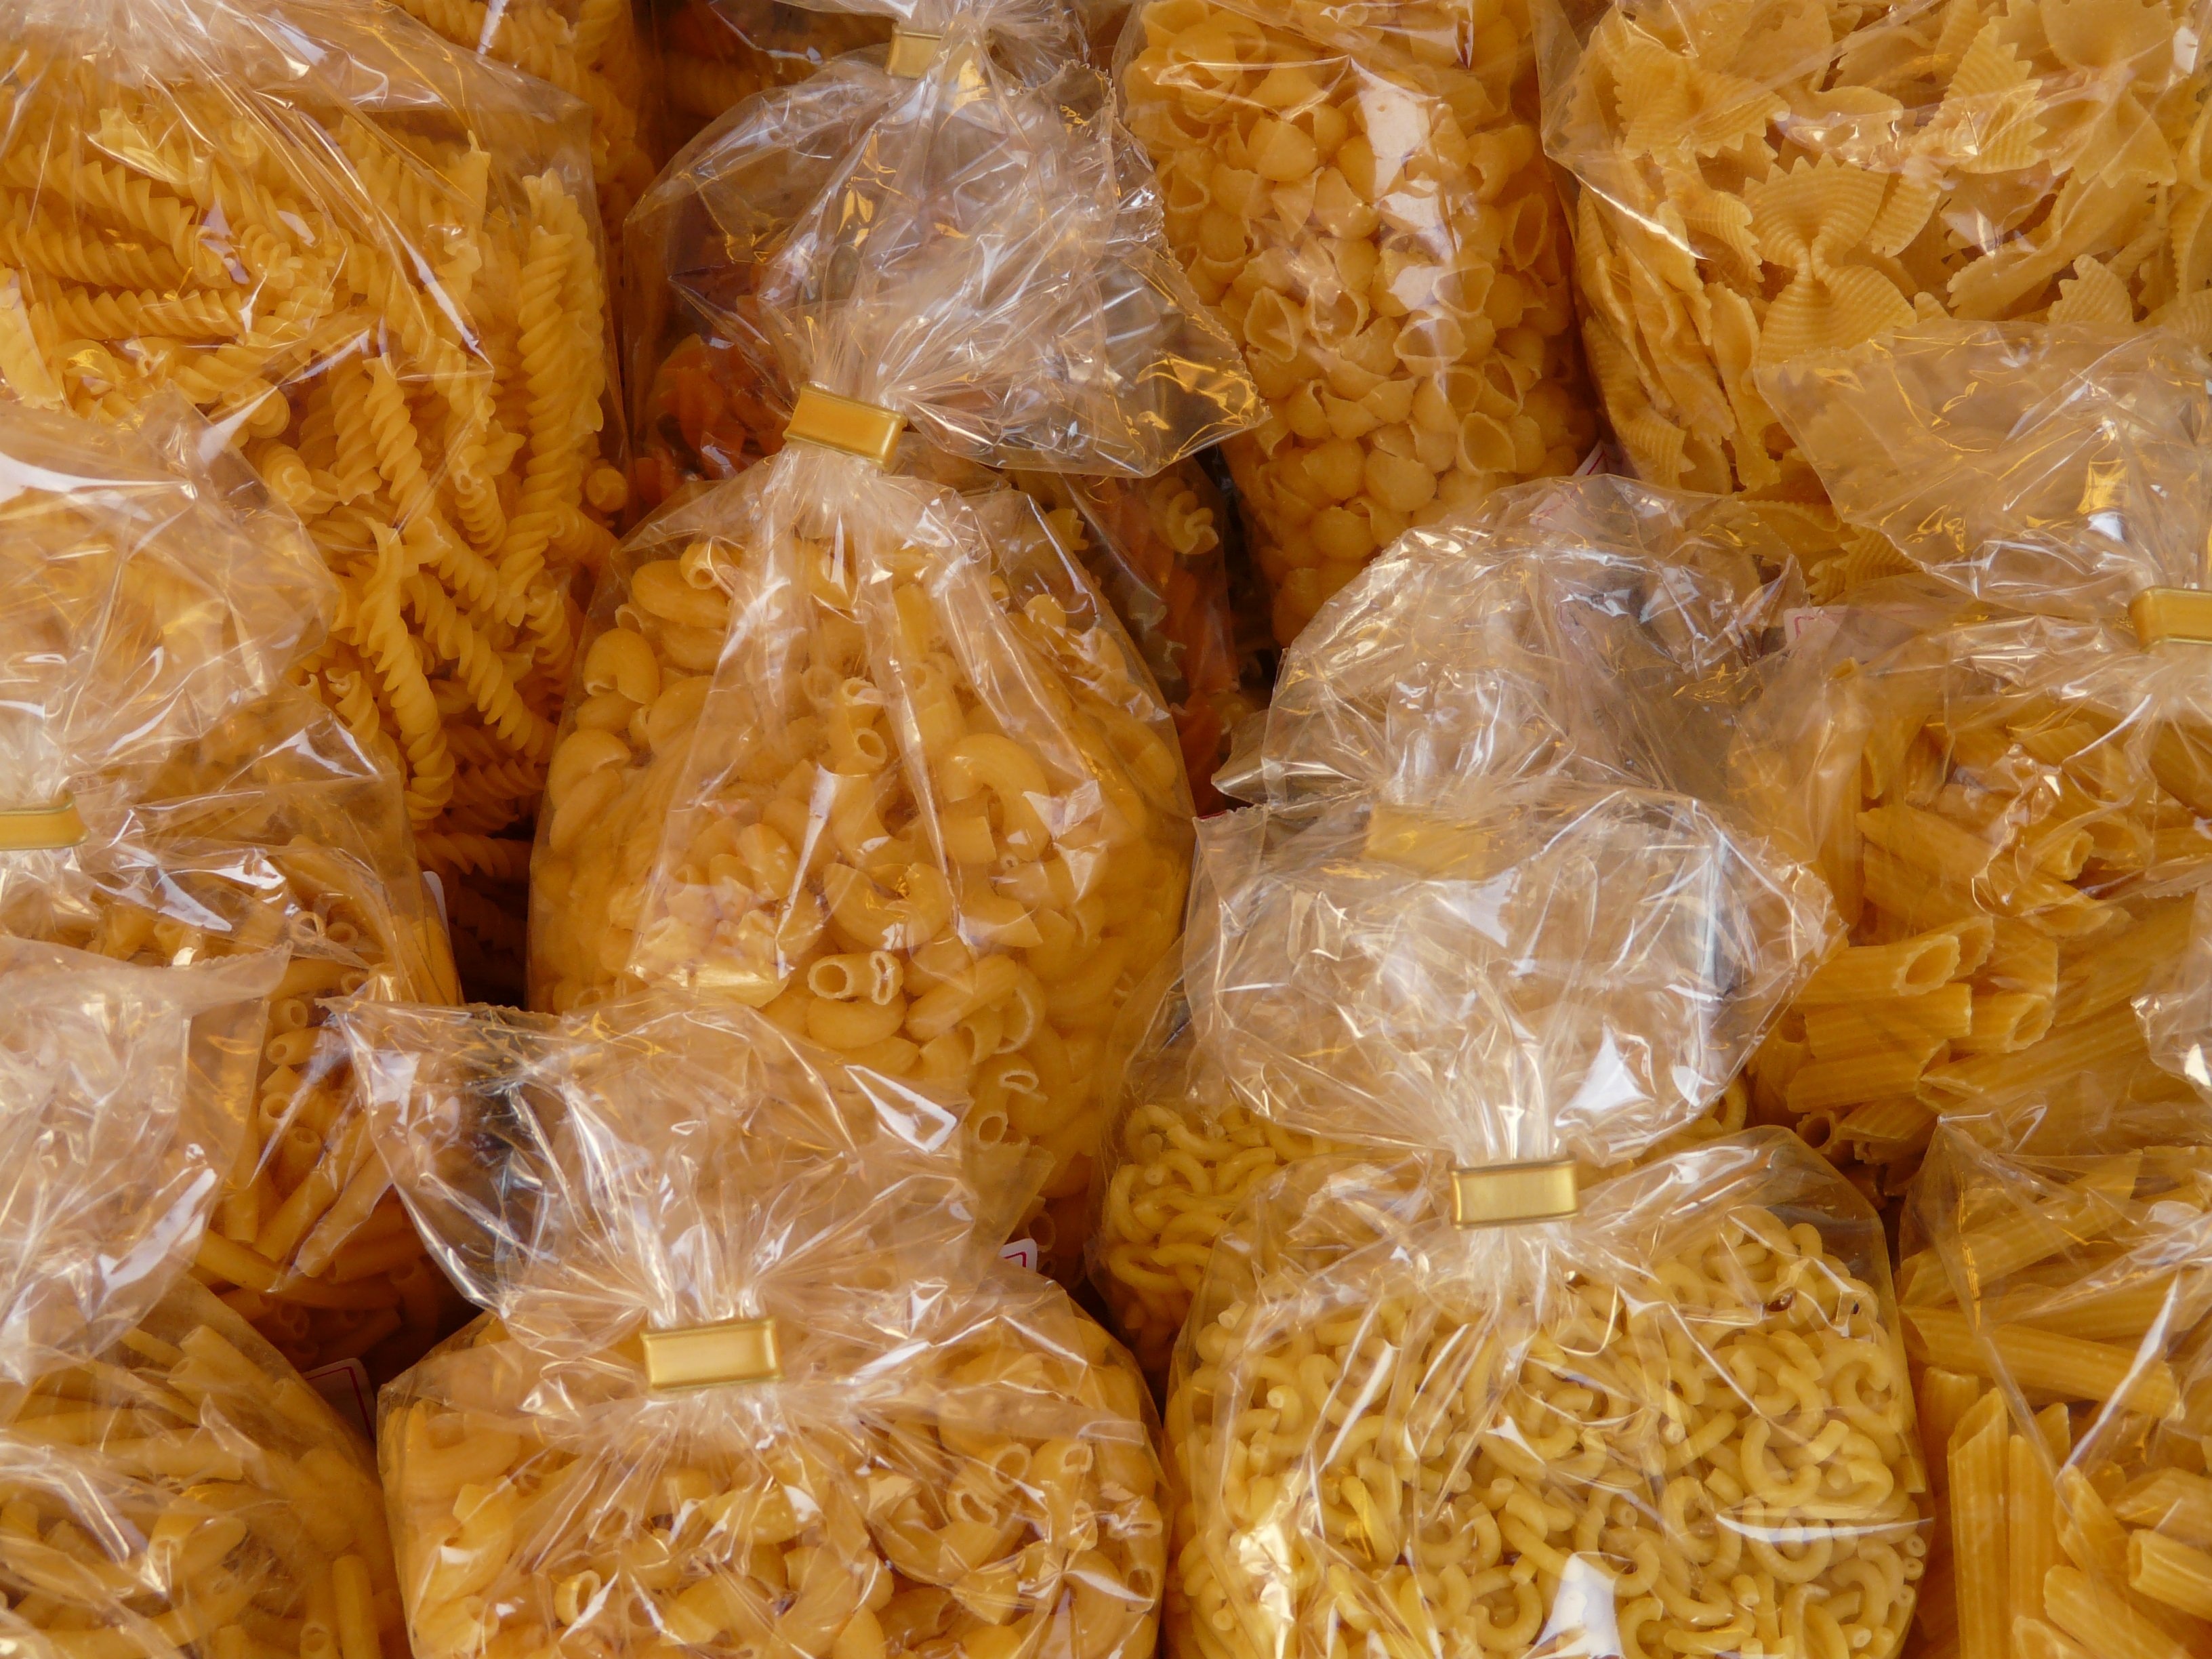
Hormuz Crisis and Food Packaging
Published by Pasquale Marzano. .
Food Packaging Paper Basic thermoplastics Should CostHow material composition drives different cost impacts [ Read all ]
Iron ore price forecast for 2026 - 2027
Published by Luca Sazzini. .
Ferrous Metals Forecast ForecastWhat are analysts' forecasts for iron ore prices? [ Read all ]
Increasing raw material prices for food packaging
Published by Pasquale Marzano. .
Energy cost Food Global Economic TrendsThe hierarchy of energy shock transmission is confirmed [ Read all ]