PricePedia Scenario for November 2026
Upward pressure on industrial commodity prices persists despite the expected decline in energy prices
Published by Pasquale Marzano. .
Forecast ForecastThe PricePedia Forecast Scenario, based on information available as of 4 November 2026, comes amid continued geopolitical uncertainty, although new signs of easing tensions have emerged in the Middle East. In early November, intensified indirect diplomatic contacts between the United States and Iran, mediated by Qatar, raised hopes of a negotiated settlement to the conflict. The Iranian government itself expressed its willingness to reach an agreement, indicating that the Strait of Hormuz could reopen within two days of a deal with Washington. Expectations of a possible de-escalation were further reinforced by the outcome of the US midterm elections on 3 November, in which the Democrats emerged victorious, potentially increasing political pressure on the Trump administration to pursue a diplomatic solution.
These developments have helped reduce the geopolitical risk premium embedded in energy commodity prices, although the impact has differed between oil and natural gas, partly reflecting their respective supply conditions.
In the oil market, exports from Gulf countries have recovered a significant share of their pre-conflict volumes, supported by the partial resumption of shipments through the Strait of Hormuz and the use of alternative routes. The natural gas market, by contrast, continues to face severe restrictions on LNG exports from the Persian Gulf, exacerbating Europe's supply challenges at a time when gas storage levels are particularly low at the start of the winter season.
These contrasting market conditions are reflected in the comparison of the Brent crude oil and TTF natural gas futures curves recorded on 4 November and 1 October 2026, shown in the charts below.
Energy Commodity Futures Curves
Brent crude oil, USD/barrel

TTF natural gas, EUR/MWh

For Brent crude oil, the November futures curve lies below the October curve across the entire period considered. Prices retain a downward-sloping profile, declining from approximately 94 dollars per barrel for early 2027 contracts to less than 80 dollars per barrel at the beginning of 2028. The market therefore continues to price in a gradual normalization of supply conditions, but at lower price levels than expected a month earlier.
For TTF natural gas, however, the recent decline in prices, supported by prospects of geopolitical de-escalation, has not been sufficient to reverse the upward revision in expectations compared with October. The futures curve recorded on 4 November remains above that of the previous month, with particularly significant differences for 2027 contracts.
These expectations are primarily driven by Europe's persistent supply constraints and the need to replenish gas storage inventories after the winter season. These factors could keep upward pressure on gas prices even if flows from the Middle East gradually return to normal.
PricePedia forecast scenario – November 2026
Contrasting expectations in the oil and natural gas markets are exerting opposing pressures, resulting in relatively limited revisions to the outlook for European energy commodity prices compared with the previous forecast scenario.
Following an expected average annual increase of nearly 30% in 2026, the forecast confirms a gradual decline in the PricePedia Energy Commodity Index during 2027, with an average annual change of -6.6%, against a backdrop of easing market tensions but still considerable uncertainty.
The outlook for the PricePedia Total Commodity Index also remains broadly unchanged from October. Following the sharp price increases of 2026, estimated at more than +15%, the forecast points to a -2.5% decline in average commodity prices in 2027, driven primarily by easing prices in the energy component.
The following chart illustrates the annual trends of the main commodity aggregates, expressed in euros, included in the PricePedia Forecast Scenario: Industrial Commodities[2], Total Commodities[3] and Energy Commodities.
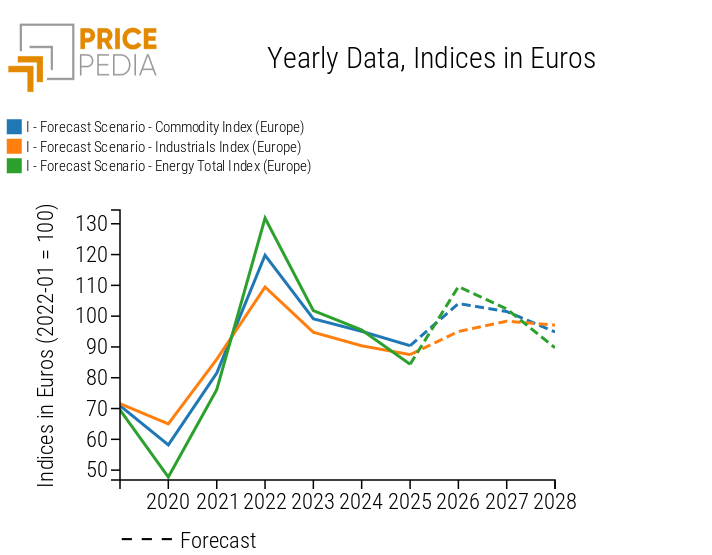
Following an expected average increase of more than +8% in 2026, European industrial commodity prices are forecast to rise by a further +3% in 2027, although at a slower pace than in the previous year. This trend would leave prices more than 37% above their 2019 average levels.
However, the aggregate index masks divergent trends across individual industrial supply chains, some of which continue to face pressure from elevated energy costs and supply chain disruptions. For European manufacturers, this translates into differing cost outlooks, highlighting the need for a more detailed assessment of individual purchasing categories.
The following table presents annual percentage changes, calculated in euros, for some of the main industrial commodity categories, ranked in descending order according to their expected price increases in 2027.
Table 1: Annual percentage changes (%) in selected industrial commodity categories, in euros
| 2024 | 2025 | 2026f | 2027f | |
|---|---|---|---|---|
| I-Forecast Scenario, 4 Nov. 2026 Info-Organic Chemicals Total Index (Europe) | −3.49 | −6.01 | +10.57 | +4.46 |
| I-Forecast Scenario, 4 Nov. 2026 Info-Ferrous Metals Total Index (Europe) | −7.68 | −7.77 | +3.15 | +3.86 |
| I-Forecast Scenario, 4 Nov. 2026 Info-Plastics and Elastomers Total Index (Europe) | −3.85 | −4.52 | +10.55 | +3.68 |
| I-Forecast Scenario, 4 Nov. 2026 Info-Non Ferrous Metals Total Index (Europe) | −0.62 | +1.85 | +19.97 | +1.32 |
Among the categories considered, organic chemicals and plastics and elastomers, which are closely linked to the petrochemical and natural gas industries, are expected to end 2026 with price increases exceeding +10%. These increases reflect both higher energy feedstock costs and supply disruptions caused by the conflict in the Persian Gulf and restrictions on shipments through the Strait of Hormuz.
For 2027, despite the expected easing of feedstock costs, prices are forecast to rise by a further +4.5% for organic chemicals and +3.7% for plastics and elastomers. This continued growth reflects both the gradual pass-through of the 2026 energy price shock along industrial supply chains and supply conditions that are expected to remain tighter than before the conflict.
A different trend is expected for ferrous metals, with price growth forecast to accelerate from +3.2% in 2026 to +3.9% in 2027. During 2026, weak European steel demand and intense international competition limited producers' ability to pass higher energy costs on to selling prices. In 2027, prospects for a gradual recovery in demand are expected to coincide with the effects of new European measures designed to protect the domestic steel market. Within this category, long steel products are expected to show the strongest price growth, with an increase of approximately 8% in 2027.
For non-ferrous metals, price growth is forecast to slow considerably to +1.3% in 2027, following an expected increase of +20% in 2026. This slowdown is consistent with the expected easing of the factors that have supported prices since the second half of 2025, as discussed in the article La crescita dei prezzi dei metalli non ferrosi è prevista proseguire anche nel 2027?.
Key takeaways
The November 2026 PricePedia Forecast Scenario confirms that the gradual easing of tensions in energy markets will not necessarily translate into lower prices for industrial purchasing materials. Persistent supply chain constraints and the gradual pass-through of higher production costs are expected to continue supporting prices, although to varying degrees across industries.
For European manufacturers, these trends highlight the importance of basing procurement planning on commodity-specific price forecasts, enabling purchasing teams to assess different cost outlooks and make more informed procurement decisions in an environment that remains uncertain.
1. The PricePedia Industrials index results from the aggregation of the indices relating to the following product categories: Ferrous, Non-Ferrous, Wood and Paper, Chemicals: Specialty, Organic Chemicals, Inorganic Chemicals, Plastics and Elastomers and Textile Fibres.
2. The PricePedia Commodity index results from the aggregation of the indices relating to industrial, food and energy commodities.
You may be interested in:

From market trends to procurement budget: how to use price forecasts to plan purchases in 2027
Published by Pasquale Marzano. .
Forecast Purchasing budget Analysis tools and methodologiesCombining a Purchasing Manager's experience with PricePedia's analytical tools to navigate procurement planning in an uncertain market environment [ Read all ]

Elastomer price forecasts for 2026–2027
Published by Luca Sazzini. .
Forecast Elastomers Natural Rubber ForecastWhat is the outlook for elastomer prices amid rising petrochemical costs and supply risks? [ Read all ]

PricePedia Scenario for October 2026
Published by Pasquale Marzano. .
Forecast ForecastThe new escalation renews upward pressure on industrial commodity prices [ Read all ]