Monthly commodity prices update for October 2026
European commodity prices rise again as energy reaches its highest level since December 2022
Published by Pasquale Marzano. .
EU Customs Global Economic TrendsIn October 2026, European prices of purchased materials rose by 2.3% compared to the previous month, driven primarily by escalating geopolitical tensions and the resulting pressure on energy markets.
In the Middle East, renewed Houthi attacks and persistent disruptions to maritime traffic through the Strait of Hormuz continued to fuel concerns over potential supply interruptions. Despite a partial recovery in oil shipments compared to previous months, traffic through the Strait remained well below pre-crisis levels. These tensions were compounded by disruptions to energy infrastructure in Russia and Ukraine, resulting from continued attacks by both sides.
Against this backdrop, Brent crude oil prices increased by 6% month-on-month, averaging 108 dollars per barrel. Even stronger upward pressure emerged in the European TTF natural gas market, where prices exceeded 100 €/MWh during the final week of October, reaching their highest level since December 2022.
The following chart illustrates the performance of euro-denominated commodity prices on the European market through PricePedia’s main aggregates, indexed to their respective January 2022 levels: Commodity[1], Industrials[2], Energy and Food.
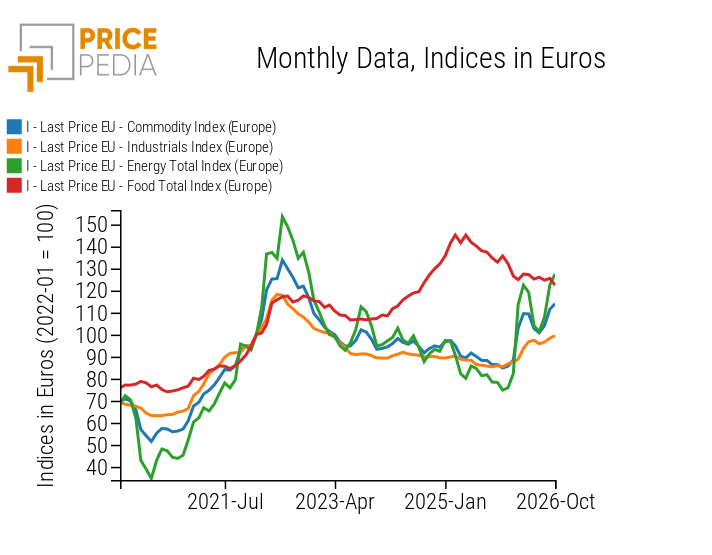
Looking at the main commodity groups, the deterioration in the geopolitical environment had the strongest impact on European physical-market prices for energy commodities, which rose by 4% in October, reaching their highest levels since December 2022. Since the outbreak of the conflict in the Persian Gulf, European energy commodity prices have increased by more than 54%.
Although at a more moderate pace, industrial commodity prices also continued to rise, increasing by 1.2% month-on-month in October. This brought their cumulative increase since February 2026 to 13.5%, highlighting the sustained pressure on production input costs faced by European manufacturers, extending well beyond energy-related expenses.
Industrial commodity price trends since the start of the conflict
The following chart breaks down the performance of the Industrial Commodities Index into its main subcategories, showing percentage changes in euro-denominated prices between February and October 2026.
Chart 2: Percentage changes in euro-denominated prices, October 2026 vs February 2026
Source: PricePedia
Across industrial commodities, prices have risen in virtually every category, with pharmaceutical chemicals being the only exception.
The categories most exposed to rising petrochemical feedstock and natural gas prices continue to record the largest increases. In particular, by October 2026, prices for organic chemicals and plastics and elastomers were more than 22% higher than in February of the same year.
Significant price increases were also recorded for textile fibres, which rose by more than 17% over the period. While synthetic fibres posted gains broadly in line with the overall category, wool prices increased by more than 30%. Unlike synthetic fibres, wool prices had already begun rising in the second half of 2025, mainly driven by a contraction in Australian supply, a key reference point for the global wool market.
Over the same period, inorganic chemical prices also increased by more than 15%. Particularly notable were the sharp rises in tungsten carbides prices, which surged by over 135%. This increase reflects a supply deficit and the global market's heavy dependence on Chinese production, as discussed in a previous article.
Another particularly sharp increase was recorded in sulfur prices (+88%). Already facing tight supply conditions, the sulfur market has come under further pressure as the conflict in the Persian Gulf has exacerbated supply disruptions.
Despite remaining broadly stable in October, non-ferrous metal prices have maintained a substantial cumulative increase of 13% compared to February 2026.
Among the remaining industrial commodity categories, specialty chemical prices rose by almost 10%, driven primarily by higher fertilizer prices (+24%). More moderate, though still significant, increases were recorded in wood and paper and ferrous metals, both of which posted average gains of approximately 7% between February and October. Within the steel sector, long steel products (+13.6%) and steel scrap (+11.5%) stood out, recording price increases well above the category average.
Do you want to stay up-to-date on commodity market trends?
Sign up for PricePedia newsletter: it's free!
1. The PricePedia Commodity index is the aggregation of Industrials, Food and Energy indices.
2. The PricePedia Industrials index is the aggregation of indices related to the following categories: Ferrous Metals, Non-Ferrous Metals, Wood and Paper, Pharmaceutical Chemicals, Chemicals: Specialty, Organic Chemicals, Inorganic Chemicals, Plastics and Elastomers, and Textile Fibers.
You may be interested in:
Monthly commodity prices update for August 2026
Published by Pasquale Marzano. .
EU Customs Global Economic TrendsEuropean commodity prices continue to rise [ Read all ]
Monthly commodity prices update for July 2026
Published by Pasquale Marzano. .
EU Customs Global Economic TrendsRenewed tensions in the Persian Gulf halt the downward trend in commodity prices [ Read all ]
Monthly commodity prices update for June 2026
Published by Pasquale Marzano. .
EU Customs Global Economic TrendsCommodity prices show mixed trends following the US-Iran peace agreement [ Read all ]