PricePedia Scenario for August 2026
Energy commodities: geopolitical risk premiums rise again
Published by Pasquale Marzano. .
Forecast ForecastThe PricePedia Forecast Scenario, based on the information available as of August 3, 2026, continues to be shaped by a high degree of geopolitical uncertainty. As discussed in the latest price update, the renewed escalation of tensions in the Persian Gulf in July led to an increase in the geopolitical risk premium embedded in energy commodity prices, with particularly visible effects on oil and natural gas markets.
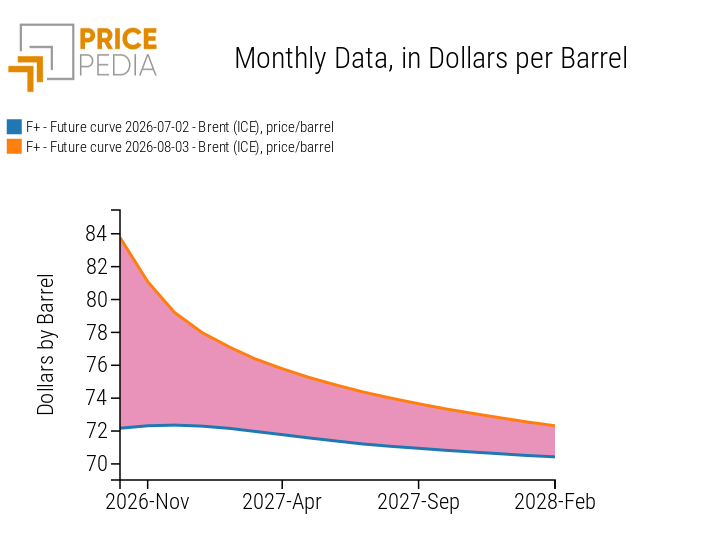
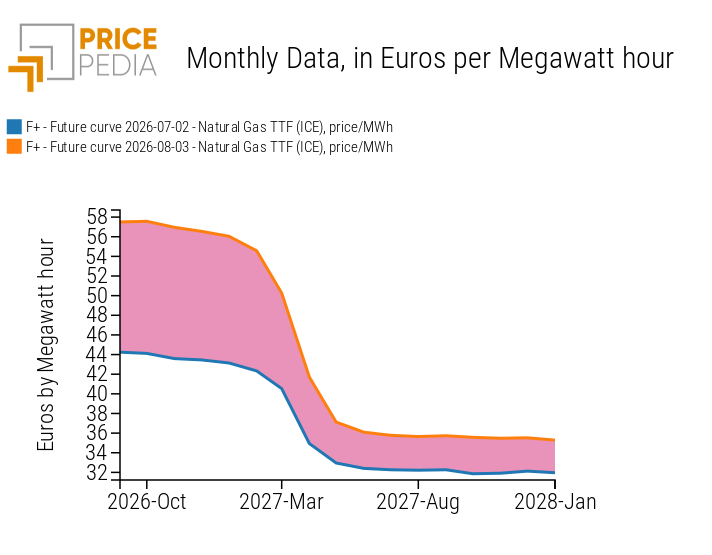
The charts below show how financial market expectations for the coming months have evolved for Brent crude oil, expressed in US dollars per barrel, and TTF natural gas, expressed in euros per MWh, comparing the futures curves observed on August 3, 2026 with those recorded on July 2, 2026.
Energy Commodity Futures Curves
Brent Crude Oil, USD/barrel
TTF Natural Gas, EUR/MWh
In both markets, early-August futures curves are positioned above the levels observed one month earlier, pointing to an upward revision in price expectations for both 2026 and 2027. In the case of Brent crude oil, the August 3 curve indicates prices slightly above $80 per barrel through the end of 2026, with an average price in 2027 close to $75 per barrel, compared with just under $72 embedded in the early-July curve. Despite this upward revision, expected prices remain below the levels priced in by the market before the agreement reached in June 2026, suggesting that only part of the risk premium observed during the most acute stages of the crisis has returned to market expectations.
The revision is even more pronounced in the case of TTF natural gas. The early-August futures curve implies prices slightly below €60/MWh for 2026, compared with around €43/MWh in the July 2 curve and €48/MWh at the beginning of June. The larger revision compared with oil reflects the particular vulnerability of the European natural gas market to a deterioration in the geopolitical environment. The risk of disruptions to LNG flows through the Strait of Hormuz comes at a time when European gas inventories are at particularly low seasonal levels, reducing the market's ability to absorb potential supply-side shocks.
Despite the increase in the short term, both curves point to a gradual easing of prices during 2027. This profile is consistent with expectations of a gradual improvement in supply conditions and a reduction in the geopolitical risk premium, associated with a possible normalization of trade flows through the Strait of Hormuz. However, considerable uncertainty remains regarding both the timing and the conditions under which such normalization may take place.
PricePedia Forecast Scenario, August 2026
The upward revision in oil and natural gas price expectations directly affects the outlook for European energy commodities. On average, prices are now expected to rise by +15.2% in 2026, roughly twice the increase projected in the previous scenario. In 2027, by contrast, the assumption of a gradual easing of geopolitical tensions and a normalization of trade flows through the Strait of Hormuz results in an expected average annual decline in energy prices of -9.9%.
Higher energy price pressures also affect the overall European commodity index. The PricePedia Forecast Scenario projects an average increase of +7.6% in 2026, followed by a -4.8% decline in 2027. The scenario therefore remains characterized by significant upward price pressure in 2026, largely driven by the energy shock, followed by a partial correction in 2027.
The table below reports annual changes, expressed in euros, for the main commodity aggregates included in the PricePedia Forecast Scenario: Industrial Commodities[1], Total Commodities[2], Energy Commodities and Food Commodities.
Table 1: Annual Growth Rates (%) of PricePedia Aggregate Indices, in Euro
| 2024 | 2025 | 2026f | 2027f | |
|---|---|---|---|---|
| I-Forecast Scenario, 3 Aug. 2026 Info-Commodity Index (Europe) | −4.10 | −4.90 | +7.60 | −4.82 |
| I-Forecast Scenario, 3 Aug. 2026 Info-Energy Total Index (Europe) | −6.16 | −11.67 | +15.24 | −9.87 |
| I-Forecast Scenario, 3 Aug. 2026 Info-Industrials Index (Europe) | −4.63 | −3.16 | +5.17 | +1.50 |
| I-Forecast Scenario, 3 Aug. 2026 Info-Food Total Index (Europe) | +8.83 | +17.11 | −8.73 | −6.90 |
As regards industrial commodities, overall prices are expected to increase by around +7% over the 2026-2027 period, representing a slightly more moderate trend than in the previous scenario. The outlook, however, varies significantly across individual commodity groups.
The strongest increases are expected for non-ferrous metals and, in particular, for copper and copper alloys, whose prices are projected to rise by around +25% overall during the two-year period. This trend is mainly supported by structurally robust demand prospects, driven by the expansion of electricity infrastructure, the energy transition and growing demand associated with digitalization. Significant increases are also expected for the different types of aluminium, with prices projected to rise by around +14% on average in 2026, followed by a partial correction during 2027.
A strong increase is also expected in 2026 for thermoplastic polymers (+13.6%). In this case, the annual average increase largely reflects price gains already accumulated in previous months, resulting from the transmission of the energy shock to petrochemical feedstock and production costs. As these pressures gradually ease, however, the scenario points to a downward price trend over the coming months.
Across other industrial commodity segments, the outlook remains more heterogeneous. Ferrous metals, in particular, are expected to show only limited growth in 2026 (+1.1%), followed by a moderate strengthening in 2027 (+3.5%). Despite the expected recovery, price levels would nevertheless remain below the average recorded in 2024.
1. The PricePedia Industrials index results from the aggregation of the indices relating to the following product categories: Ferrous, Non-Ferrous, Wood and Paper, Chemicals: Specialty, Organic Chemicals, Inorganic Chemicals, Plastics and Elastomers and Textile Fibres.
2. The PricePedia Commodity index results from the aggregation of the indices relating to industrial, food and energy commodities.
You may be interested in:
Crude steel production on the decline: how are forecasts for ferrous metals changing?
Published by Luca Sazzini. .
Ferrous Metals Forecast ForecastThe decline in crude steel production and the escalation in the Middle East are affecting the PricePedia outlook for ferrous metal prices [ Read all ]

PricePedia Scenario for September 2026
Published by Pasquale Marzano. .
Forecast ForecastPurchase material prices amid geopolitical tensions and supply shortages [ Read all ]
How are the rules governing the European steel market changing?
Published by Luca Sazzini. .
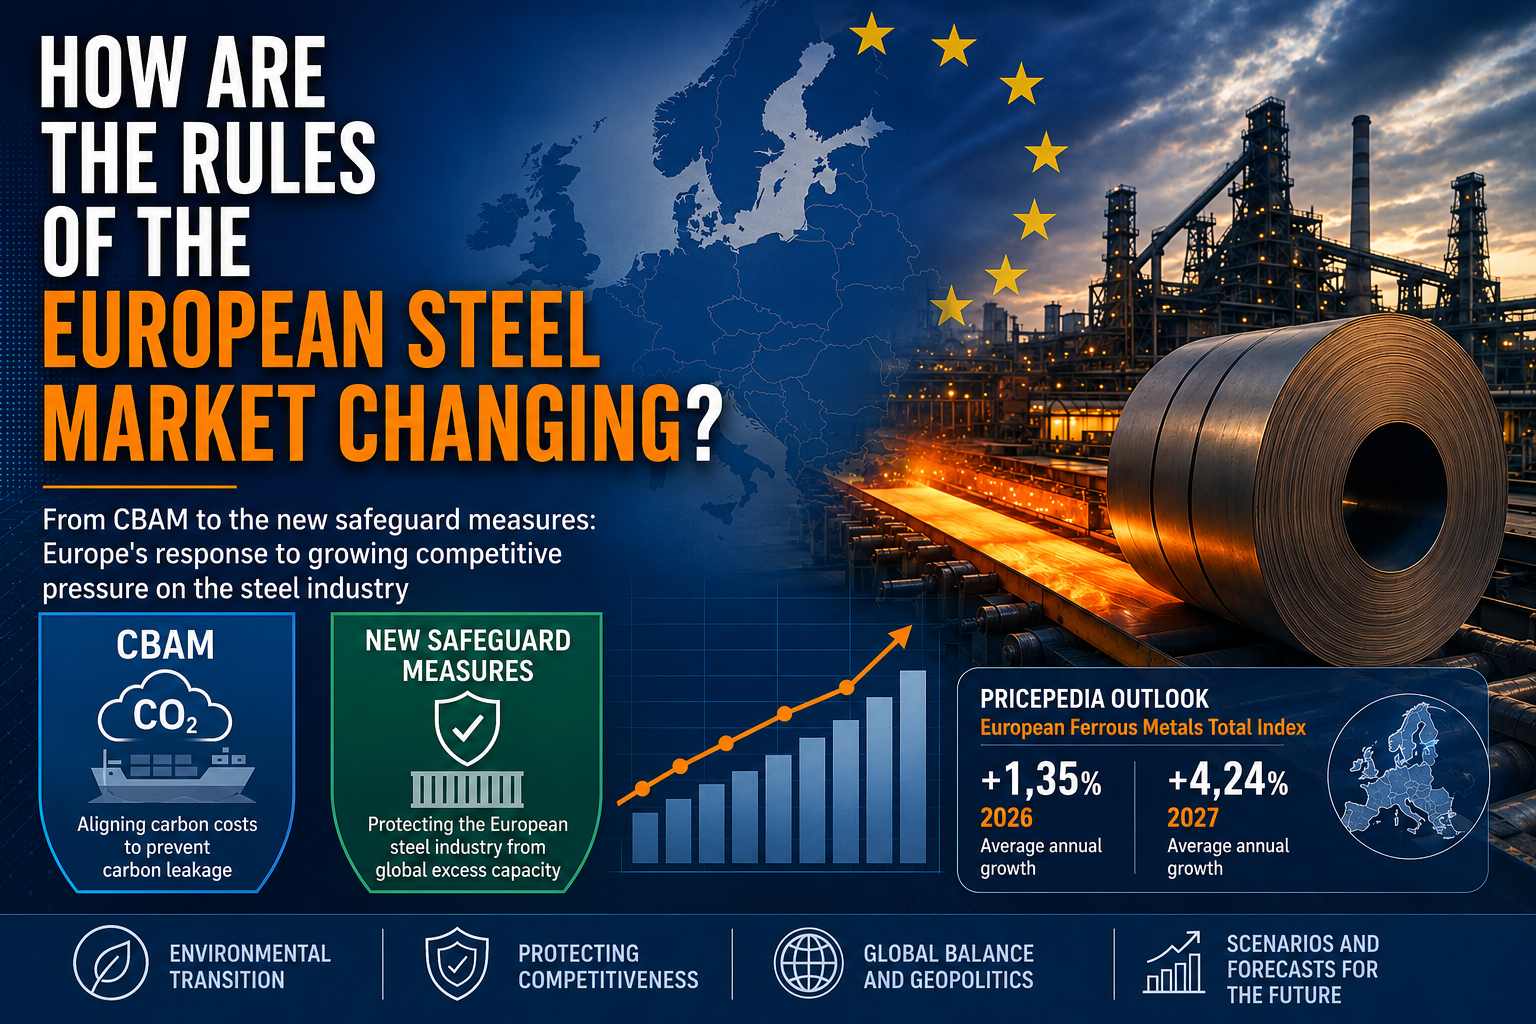
Ferrous Metals Forecast Energy Transition Import tariffsFrom the CBAM to new safeguard measures: the European response to growing competitive pressure on the steel industry [ Read all ]