The Chinese industry appears less vulnerable to the shock of international energy prices
Chinese dataset update for April 2026
Published by Luca Sazzini. .
Conjunctural Indicators Global Economic TrendsIn the month of April 2026, the growth phase in Chinese export prices continues, which began in October 2025, supported by production cuts in Chinese steel and aluminium aimed at containing excess supply and by the strengthening of industrial activity linked to stimulus measures in the real estate sector.
In this context, the March 2026 energy shock does not appear to have led to a significant acceleration in price growth dynamics.
In aggregate terms, in April 2026, Chinese export prices in US dollars, measured by the FOB indices of Total Commodity[1] and Industrial products[2], recorded month-on-month changes of 3.9% and 2.7% respectively. In euros, the changes in the same indices were more contained, at 2.6% and 1.4% respectively, reflecting the strengthening of the euro against the dollar during April.
The following chart shows the dynamics, in US dollars, of FOB export prices over the last two years for the Chinese Total Commodity index and the China Industrial index.
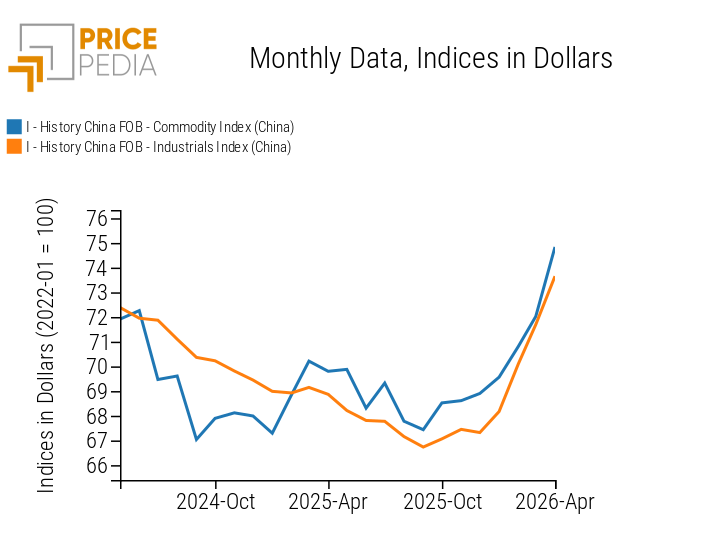
The main factor contributing to the containment of price growth in Chinese industrial commodity exports is the limited impact of the energy shock on the country’s input costs. Unlike Europe, a significant share of China’s energy imports is governed by long-term contracts, which dampen the immediate transmission of international market fluctuations to domestic costs.
Furthermore, China benefits from stable natural gas supplies at low prices from Turkmenistan and, since 2022, also from Russia.
These advantages have ensured greater stability in production costs, which in turn translates into lower upward pressure on Chinese industrial commodity export prices.
Do you want to stay up-to-date on commodity market trends?
Sign up for PricePedia newsletter: it's free!
Analysis of industrial commodities by individual product category
The table below shows the dynamics of month-on-month changes in Chinese export prices in US dollars, for the product categories included in the industrial commodities aggregate.
Month-on-month changes in industrial commodities by product category, expressed in US dollars
| 2025-12 | 2026-01 | 2026-02 | 2026-03 | 2026-04 | |
|---|---|---|---|---|---|
| Historical China FOB - Total Ferrous Index (China) | −1.45 | −0.58 | +3.93 | +0.47 | +0.04 |
| Historical China FOB - Total Non-Ferrous Index (China) | +1.85 | +4.73 | +4.82 | +2.70 | +1.30 |
| Historical China FOB - Total Plastics and Elastomers Index (China) | −0.33 | −0.87 | +0.36 | +2.93 | +5.96 |
| Historical China FOB - Total Organic Chemicals Index (China) | −1.40 | +0.16 | +0.71 | +3.56 | +3.54 |
| Historical China FOB - Total Inorganic Chemicals Index (China) | −0.69 | +2.55 | +3.43 | +2.48 | +4.47 |
| Historical China FOB - Total Specialty Chemicals Index (China) | −2.52 | +0.26 | +1.25 | +1.40 | +2.65 |
| Historical China FOB - Total Pharmaceutical Chemistry Index (China) | −1.83 | −3.66 | −0.33 | +1.50 | +7.48 |
| Historical China FOB - Total Textile Fibers Index (China) | −0.07 | −0.46 | +0.68 | +3.64 | +7.32 |
In April, increases in Chinese industrial commodity export prices were relatively limited compared to the corresponding increases in international market prices.
The product category that recorded the largest month-on-month change was Pharmaceutical Chemistry, with prices in US dollars rising by 7.5% compared to March 2026. Within this segment, the most significant increase concerned methionine, whose FOB prices showed a monthly rise of 23%. Although this is a particularly strong variation, it is still more than four percentage points lower than the month-on-month change in the corresponding CIF import prices.
The second fastest-growing category was Textile Fibers, driven in particular by the increase in polypropylene, with Chinese FOB export prices rising by almost 18% in April. Despite the significant magnitude of this increase, it is still substantially lower than that of the relevant financial benchmark listed on the Chicago Mercantile Exchange (CME), which in April recorded an increase of more than 30% compared to March levels.
A further significant increase was recorded in Thermoplastics and Elastomers, which rose by almost 6% in April. Here again, the increase in Chinese export prices was significantly lower than that of the corresponding CIF import prices. In the case of polyethylene, for example, the various types exported by China recorded price increases less than half those observed for imports, whose CIF prices rose by more than 10% month-on-month.
The categories with the smallest price increases were Industrial Metals, both ferrous and non-ferrous.
Overall, these data suggest a Chinese industry capable of absorbing, at least partially, the rise in international energy prices, which is only partially transmitted to industrial commodity export prices, thereby helping to strengthen China’s competitiveness in global markets.
[1] The PricePedia FOB China Total Commodity index is an aggregation of FOB indices for industrial and energy commodities.
[2] The China Industrial FOB price index is an aggregation of FOB indices for the following product categories: Ferrous, Non-Ferrous, Plastics and Elastomers, Organic Chemicals, Inorganic Chemicals, Specialty Chemicals, Pharmaceutical Chemistry, and Textile Fibers.
You may be interested in:

Expectations of tighter monetary policy are weighing on commodity markets
Published by Luca Sazzini. .
Conjunctural Indicators Commodities Financial WeekThe decline in prices is affecting most sectors [ Read all ]

Commodity markets between supply risks and geopolitical uncertainty
Published by Luca Sazzini. .
Conjunctural Indicators Commodities Financial WeekThe strength of the U.S. economy is bolstering expectations of a more restrictive monetary policy [ Read all ]

China economic update August 2026
Published by Luca Sazzini. .
Conjunctural Indicators Global Economic TrendsIncreased competitive pressure is driving down the prices of Chinese commodities [ Read all ]