China economic update June 2026
Geopolitical easing moderates the growth of Chinese commodity FOB prices
Published by Luca Sazzini. .
Conjunctural Indicators Global Economic Trends
In the article Monthly commodity prices update for June 2026, the slowdown in the growth of European commodity prices in June was highlighted, following the signing of the Memorandum of Understanding (MoU) between the US and Iran, which contributed to a temporary cessation of hostilities and allowed the reopening of the Strait of Hormuz.
The easing of geopolitical tensions led to a reduction in pressure on energy markets: the financial price of Brent, the global benchmark for the oil market, recorded a monthly average of $85/barrel in June, down by -18% compared with the previous month.
The reduction in energy raw material costs and the partial restoration of commodity availability from the Persian Gulf led to a slowdown in the growth of Chinese export FOB prices in June. These prices, however, continue to show an upward trend, supported by the greater competitiveness of Chinese prices, which remain significantly below international levels.
The following chart shows the dollar-denominated dynamics over the last two years of Chinese export FOB prices for the aggregate indices of Total Commodity[1] and Industrial Commodities[2].
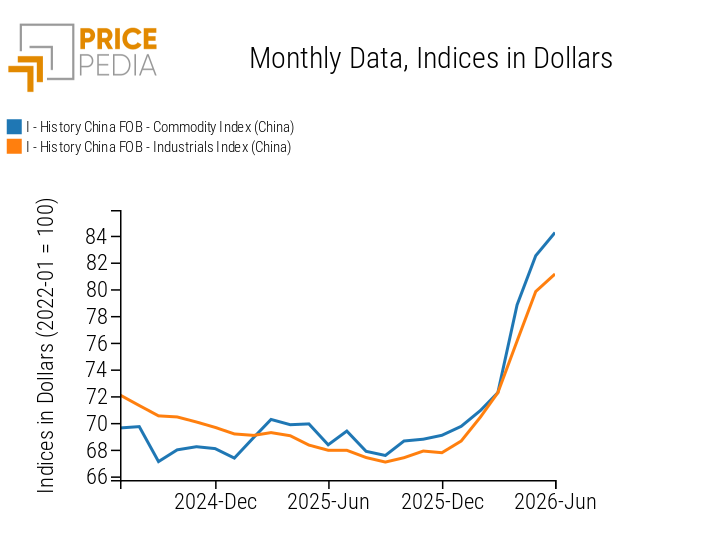
In aggregate terms, Chinese export prices in dollars, measured by the FOB aggregate indices for Total Commodity and Industrial Products, recorded month-on-month changes of 2.1% and 1.6%, respectively.
In euros, the changes in the same indices were slightly higher, at 3.5% and 3.1%, respectively, due to the depreciation of the euro against the dollar during June.
Do you want to stay up-to-date on commodity market trends?
Sign up for PricePedia newsletter: it's free!
Analysis of industrial commodities by product category
The following table shows the month-on-month changes in dollar-denominated Chinese export prices for the product categories included in the Industrial Commodities aggregate.
Monthly variations of industrial commodities by individual commodity category, expressed in dollars
| 2026-01 | 2026-02 | 2026-03 | 2026-04 | 2026-05 | 2026-06 | |
|---|---|---|---|---|---|---|
| I-History China FOB-Ferrous Metals Total Index (China) | −0.11 | +3.64 | +0.84 | +0.68 | +1.28 | −0.72 |
| I-History China FOB-Non Ferrous Metals Total Index (China) | +4.72 | +4.77 | +2.69 | +1.36 | +4.88 | +2.08 |
| I-History China FOB-Plastics and Elastomers Total Index (China) | −0.78 | +0.41 | +2.91 | +10.70 | +6.24 | +1.83 |
| I-History China FOB-Organic Chemicals Total Index (China) | +0.09 | +0.69 | +4.00 | +15.46 | +7.45 | +2.95 |
| I-History China FOB-Inorganic Chemicals Total Index (China) | +2.48 | +3.46 | +4.50 | +6.97 | +6.45 | +2.76 |
| I-History China FOB-Specialty Chemicals Total Index (China) | +0.20 | +1.25 | +2.03 | +2.63 | +5.50 | +2.82 |
| I-History China FOB-Pharmaceutical Chemicals Total Index (China) | −3.66 | −0.33 | +1.50 | +16.34 | +5.88 | +1.51 |
| I-History China FOB-Textile Fibers Total Index (China) | −0.46 | +0.70 | +3.64 | +9.11 | +4.78 | +1.88 |
In June, the only product category showing a price contraction was Ferrous Metals, mainly affected by the oversupply of steel and iron ore in the Chinese market. All other categories continued their upward price trend, although with more moderate increases compared with the previous month.
The most significant month-on-month increases, close to 3%, affected three categories within the chemical sector: organic, specialty and inorganic chemicals.
Within Organic Chemicals, the product category that recorded the strongest growth, monthly increases above 10% were observed for the dollar-denominated FOB prices of methionine, polymeric methylene diphenyl diisocyanate (MDI) and benzyl alcohol.
In the Specialty Chemicals segment, the most significant increase concerned titanium dioxide, while among Inorganic Chemicals products, sulfuric acid stood out. The latter represents the industrial commodity with the highest growth in June, with a month-on-month dollar-denominated increase of 83% and a year-on-year increase of 390%. The exceptional rise was mainly due to the shortage of sulfur, a key raw material for sulfuric acid production, caused by supply disruptions linked to the closure of the Strait of Hormuz, as analysed in the article Sulfuric Acid: Sulfur Sets the Price.
Excluding the chemical sector, the greatest price pressures affected Non-Ferrous Metals, with the most significant increases recorded for manganese ore and cobalt metal, whose prices rose by 14% and 12% month-on-month, respectively.
[1] The PricePedia FOB Total Commodity China Index results from the aggregation of FOB indices for industrial and energy commodities.
[2] The PricePedia FOB Industrial China Price Index results from the aggregation of FOB indices for the following product categories: Ferrous Metals, Non-Ferrous Metals, Plastics and Elastomers, Organic Chemicals, Inorganic Chemicals, Specialty Chemicals, Pharmaceutical Chemicals and Textile Fibres.
You may be interested in:

Uncertainty in the commodity markets remains high
Published by Luca Sazzini. .
Conjunctural Indicators Commodities Financial WeekCommodity prices show divergent trends [ Read all ]

From Hormuz to Bab el-Mandeb, tensions are rising over energy commodity prices
Published by Luca Sazzini. .
Conjunctural Indicators Commodities Financial WeekIncreased supply is driving down cobalt prices [ Read all ]

China economic update July 2026
Published by Luca Sazzini. .
Conjunctural Indicators Global Economic TrendsThe temporary decline in energy prices halts the rise in Chinese commodity prices [ Read all ]