The reinstatement of the naval blockade against Iran is heightening risks in the energy markets
Supply concerns are driving up commodity prices
Published by Luca Sazzini. .
Conjunctural Indicators Commodities Financial Week
The reinstatement of the U.S. naval blockade against Iranian ports and the continuation of hostilities between the United States and Iran have undermined the Memorandum of Understanding, with Washington reportedly considering an intensification of military operations while Tehran has ruled out the start of new negotiations.
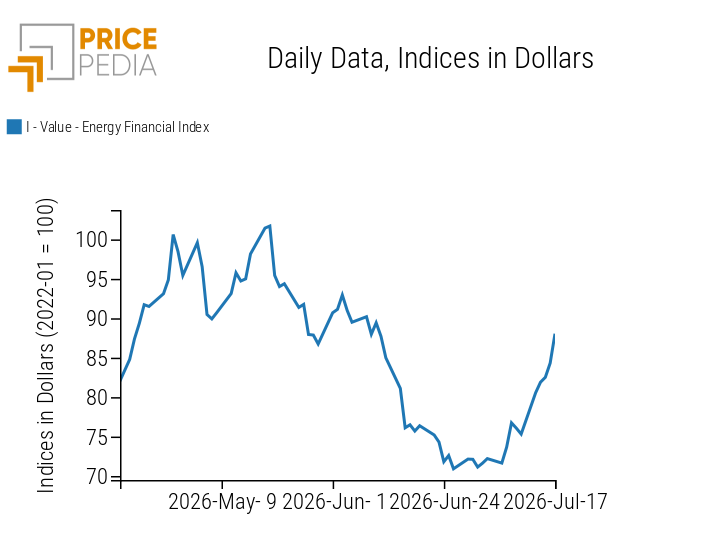
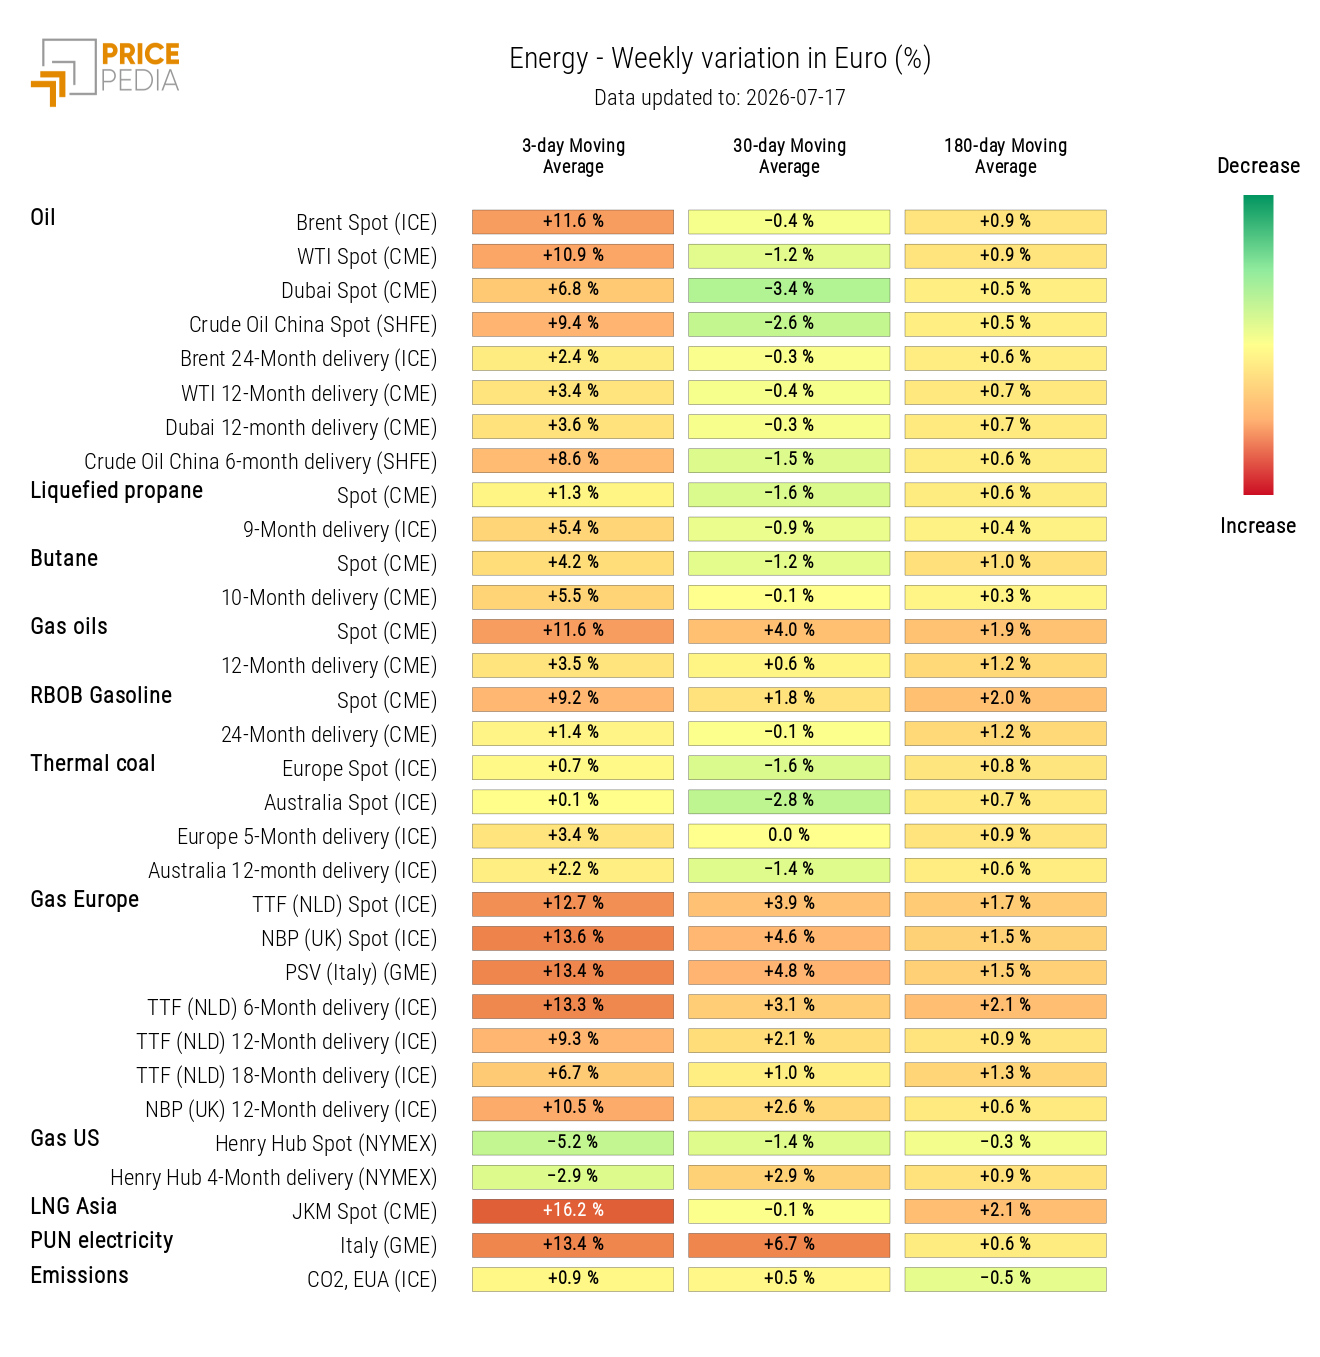
The deterioration of the geopolitical environment has once again increased the risk premium in energy markets, pushing the price of Brent crude oil to nearly $90 per barrel, up 16% on a weekly basis.
The strongest increases, however, were recorded in the natural gas market, which remains the segment most exposed to geopolitical tensions in the Middle East.
The main concerns relate to the continuity of supplies from Qatar, which accounts for approximately one-fifth of global liquefied natural gas (LNG) exports. The risk of further price pressures comes at a time when European gas inventories remain relatively low, electricity demand for cooling is increasing, and competition between Europe and Asia for LNG supplies has intensified.
Accordingly, the financial benchmarks for the regional natural gas markets in Europe (TTF) and Asia (JKM) recorded weekly increases of 18% and 27%, respectively.
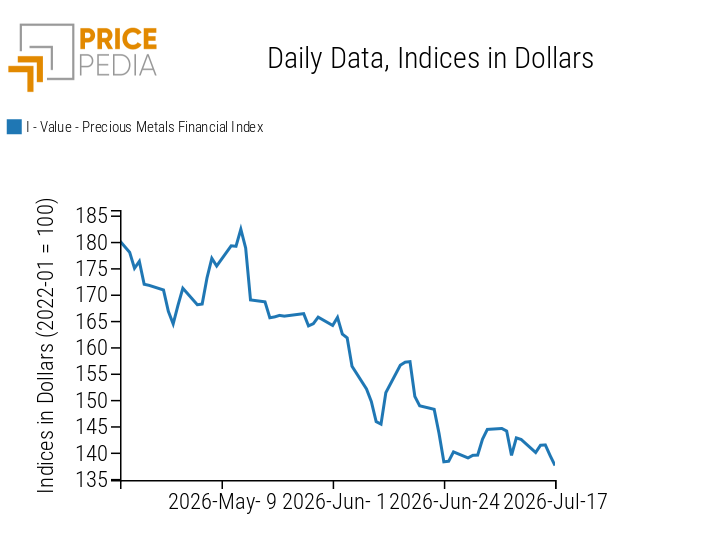
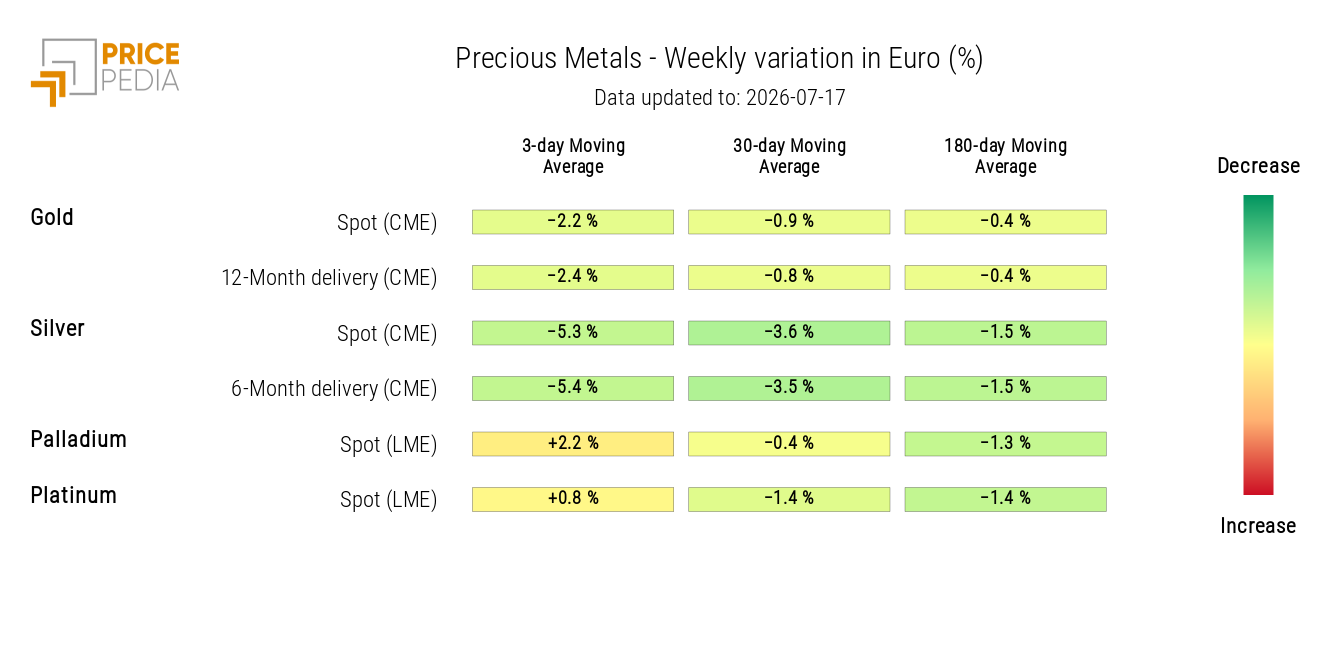
The precious metals sector continues to display a negative correlation with the energy sector, as concerns that rising energy inflation could prompt central banks to maintain restrictive monetary policies for longer continue to weigh on prices. U.S. inflation data for June, which came in below market expectations, provided partial support for safe-haven assets such as gold and silver. However, this effect was more than offset by rising inflation expectations resulting from the sharp increase in energy prices during the week.
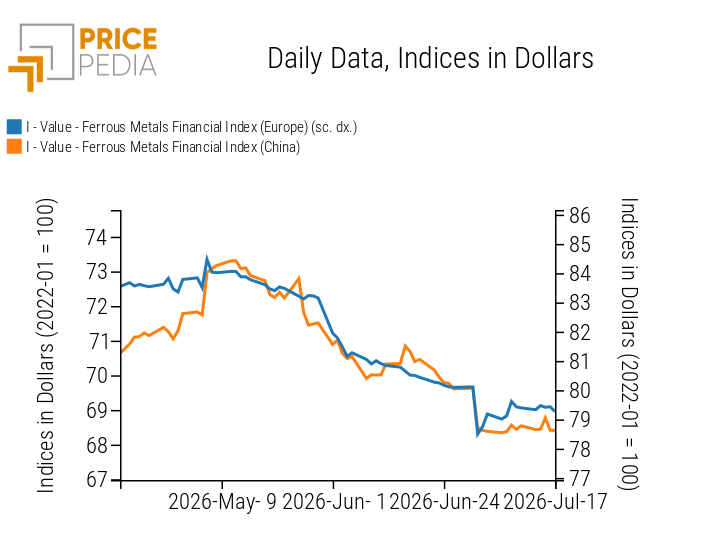
Among industrial metals, price dynamics remained broadly stable across both ferrous and non-ferrous metals. Within the ferrous segment, the most significant movement was the decline in the prices of steel reinforcing bars (rebar) traded in Shanghai, weighed down by weak steel mill margins, abundant domestic supply, and expectations of further production cuts.
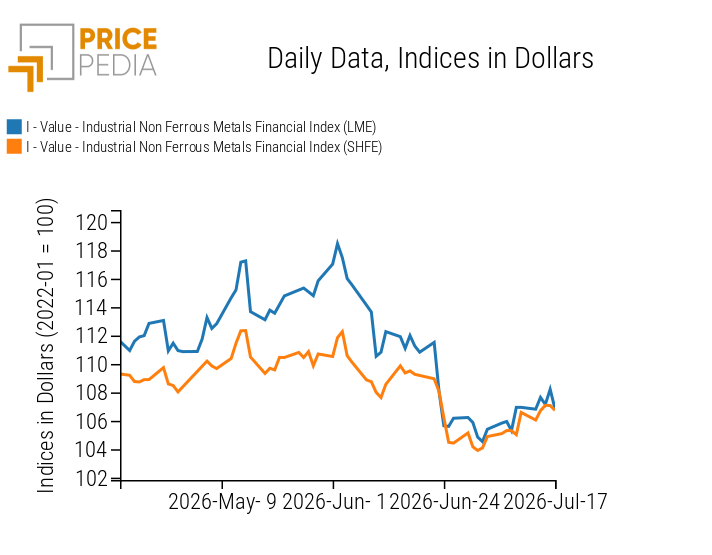
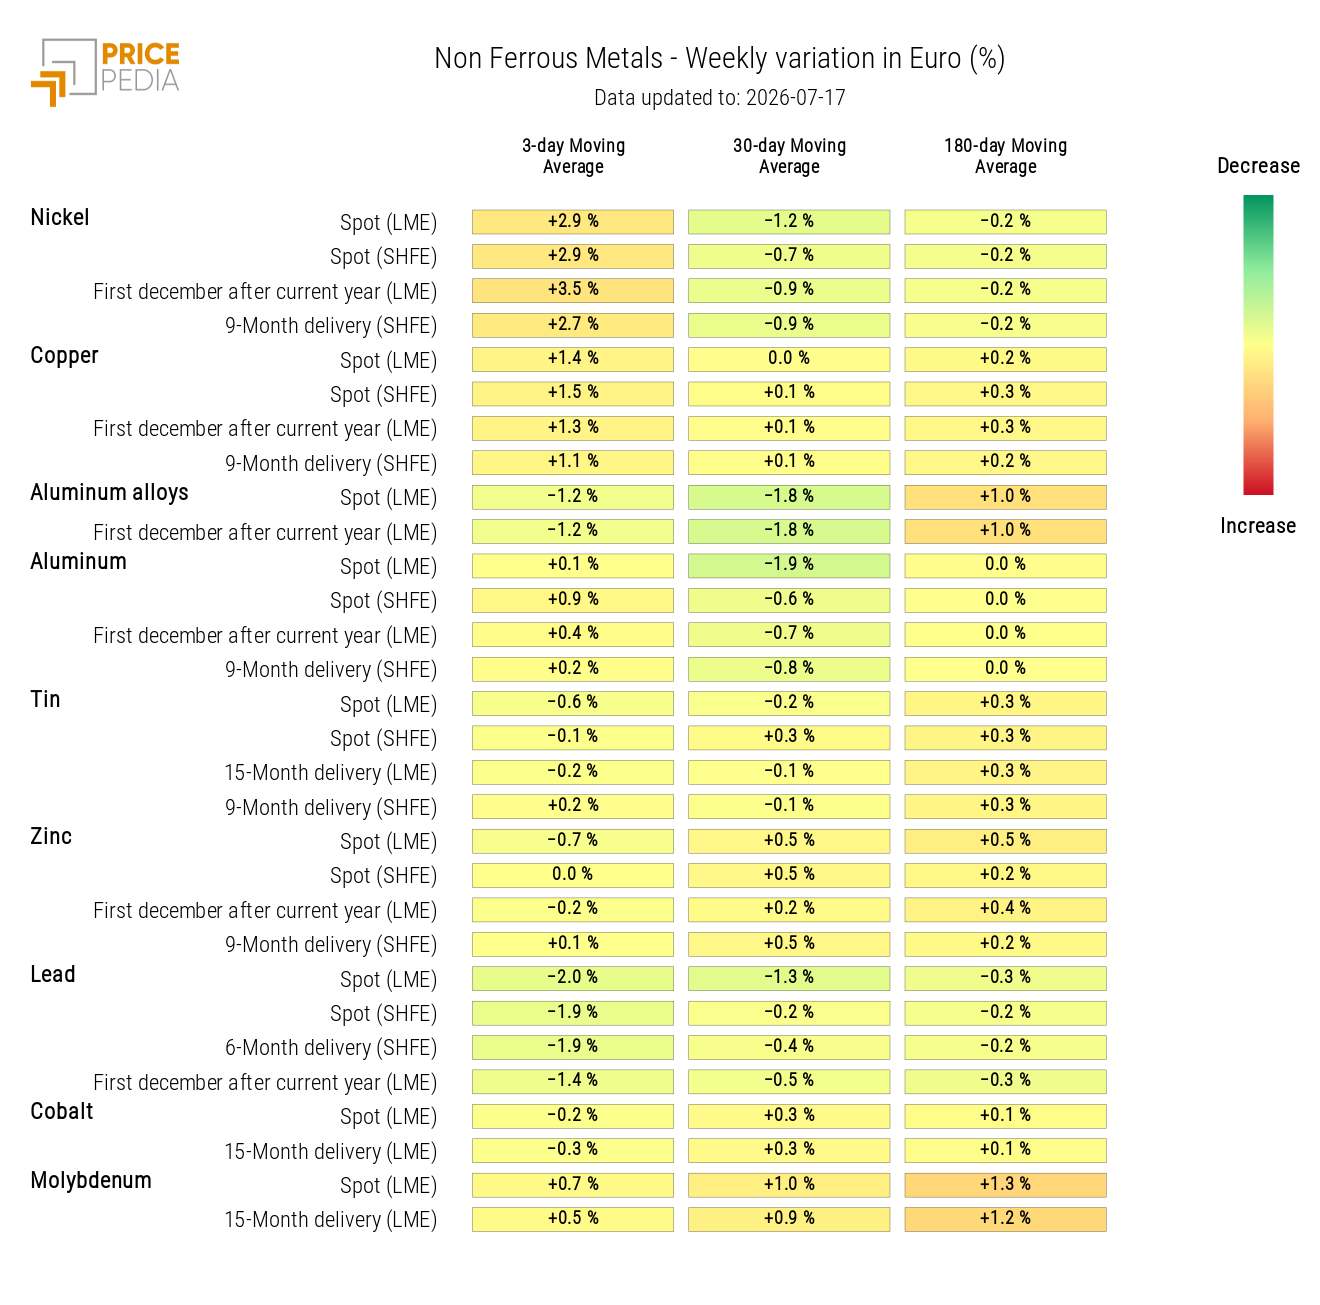
In the non-ferrous market, nickel and copper posted price increases, supported by concerns over sulfur availability, a key input in the production of sulfuric acid used in their respective extraction and refining processes.
Meanwhile, the price of aluminum remained stable. Since the beginning of the conflict, aluminum had shown the highest sensitivity to geopolitical tensions in the Middle East, reflecting the region's importance in global primary aluminum production, which accounts for approximately 10% of world output.
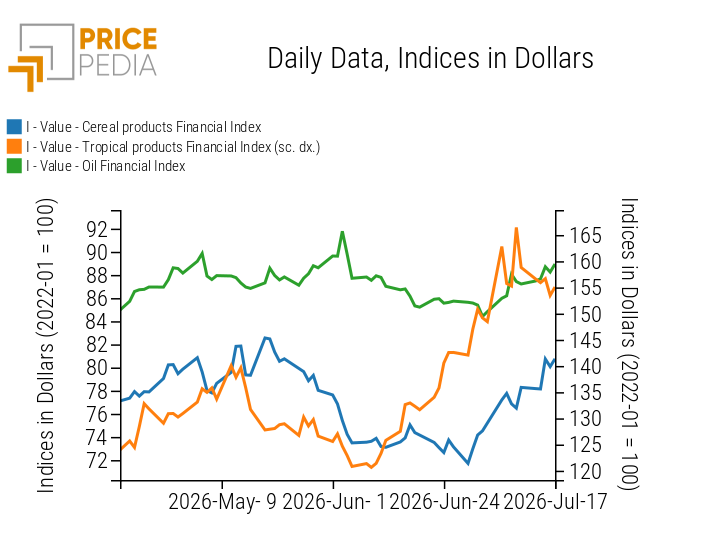
Within the food commodities sector, prices increased for cereals and oils, while tropical products recorded a decline.
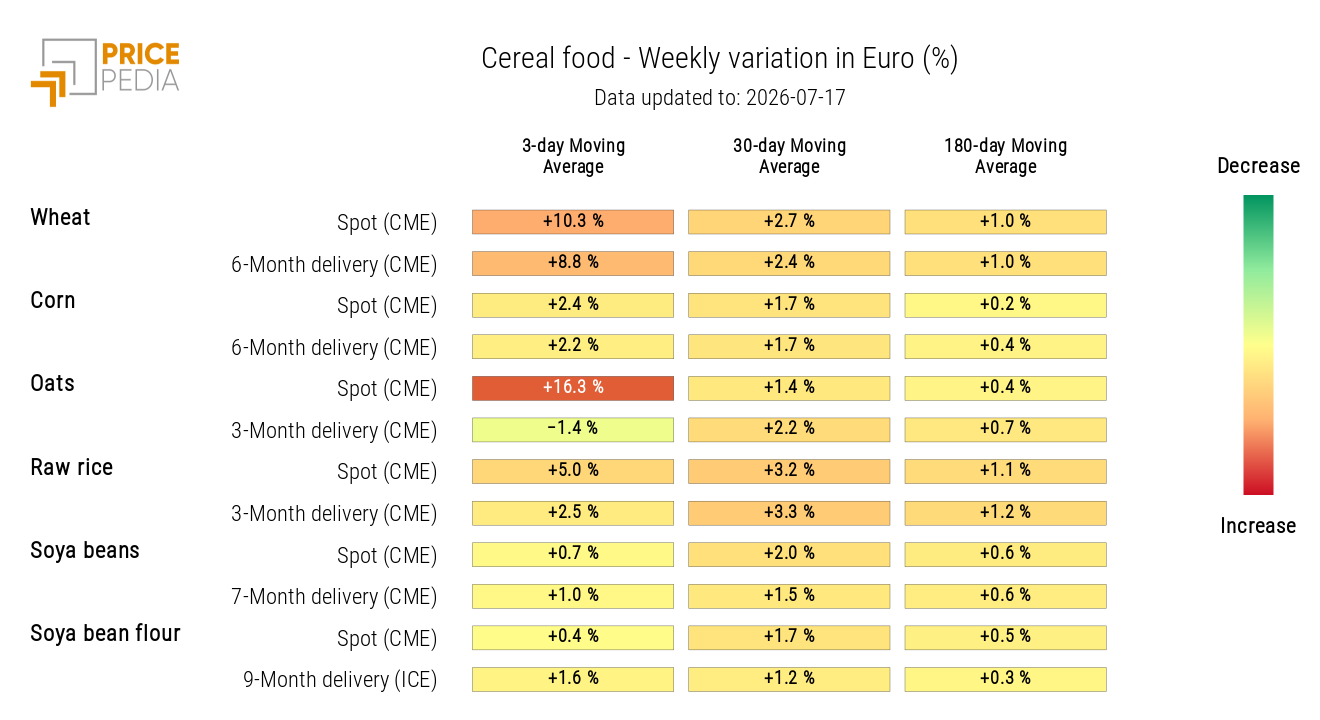
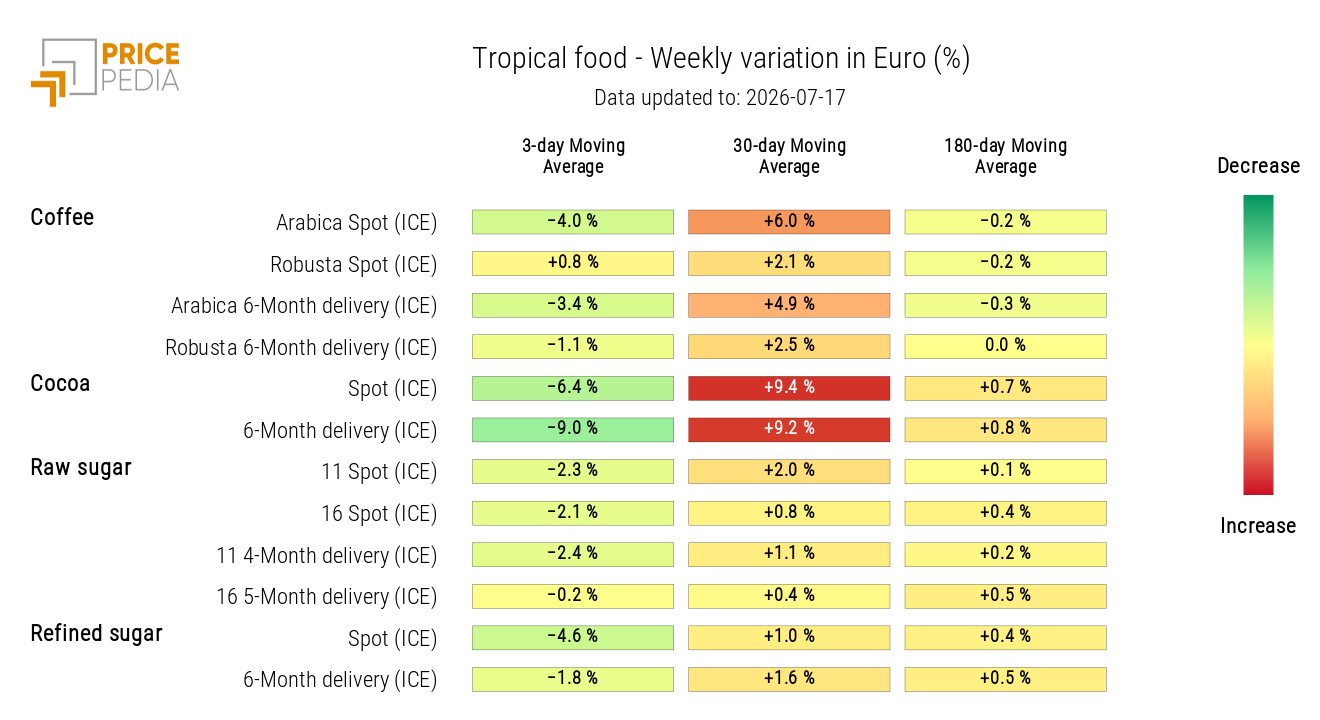
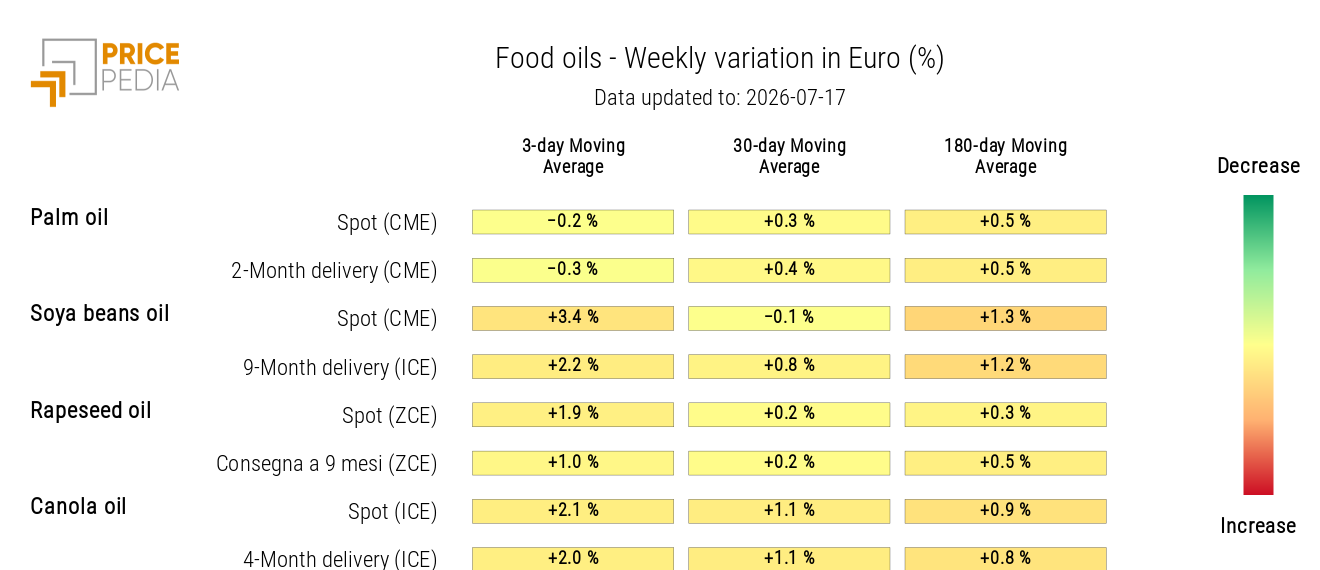
The increase in cereals prices was mainly driven by wheat and oats, supported by tighter supply expectations following downward revisions to production estimates released by the U.S. Department of Agriculture (USDA). Oils followed a similar trend, reflecting stronger demand from the biofuel industry, while tropical commodities reversed the upward trend of previous weeks, with cocoa and coffee correcting lower following profit-taking by financial investors.
NUMERICAL APPENDIX
ENERGY
The PricePedia financial index for energy products continues to recover following the collapse of the Memorandum of Understanding.
PricePedia Financial Index of Energy Prices in U.S. Dollars
The heatmap analysis highlights a broad-based increase in energy product prices.
Heatmap of Energy Prices in Euros
PRECIOUS METALS
The PricePedia financial index for precious metals continues its downward trend, in contrast with the increase in energy prices.
PricePedia Financial Index of Precious Metal Prices in U.S. Dollars
The precious metals heatmap indicates a weekly decline in gold and silver prices.
Heatmap of Precious Metal Prices in Euros
FERROUS METALS
The two financial indices for ferrous metals show broadly stable prices on a weekly basis.
PricePedia Financial Indices of Ferrous Metal Prices in U.S. Dollars
Do you want to stay up-to-date on commodity market trends?
Sign up for PricePedia newsletter: it's free!
INDUSTRIAL NON-FERROUS METALS
The financial indices for non-ferrous metals recorded a slight weekly increase in prices.
PricePedia Financial Indices of Industrial Non-Ferrous Metal Prices in U.S. Dollars
The non-ferrous heatmap highlights weekly price increases for nickel and copper.
Heatmap of Non-Ferrous Metal Prices in Euros
FOOD COMMODITIES
The financial indices for cereals and oils continued to trend upward, while the index for tropical products declined.
PricePedia Financial Indices of Food Commodity Prices in U.S. Dollars
CEREALS
The cereals heatmap highlights particularly strong price increases for wheat and oats.
Heatmap of Cereal Prices in Euros
TROPICAL PRODUCTS
The tropical products heatmap indicates lower prices for cocoa and coffee.
Heatmap of Tropical Food Commodity Prices in Euros
OILS
The heatmap analysis shows a weekly increase in edible oil prices, with the exception of palm oil.
Heatmap of Edible Oil Prices in Euros
You may be interested in:

Commodity prices between geopolitics and supply imbalances
Published by Luca Sazzini. .
Conjunctural Indicators Commodities Financial WeekWeak Chinese demand is pushing down prices for ferrous metals [ Read all ]

Expectations of tighter monetary policy are weighing on commodity markets
Published by Luca Sazzini. .
Conjunctural Indicators Commodities Financial WeekThe decline in prices is affecting most sectors [ Read all ]

Commodity markets between supply risks and geopolitical uncertainty
Published by Luca Sazzini. .
Conjunctural Indicators Commodities Financial WeekThe strength of the U.S. economy is bolstering expectations of a more restrictive monetary policy [ Read all ]