An Economic Classification of the Chemical Industry
A Map for the Economic Analysis of the Chemical Industry: From Chemical Relationships to Economic Relationships
Published by Daniel Vito Lobasso. .
Organic Chemicals Specialty chemicals Inorganic Chemicals Petrolchimica Analysis tools and methodologiesTraditional classifications used in the chemical industry group products based on molecular structure, physical properties, and the transformation processes they undergo. While this approach allows for a comprehensive understanding of their nature and technical-productive relationships, it is less suited for monitoring and interpreting the sector's economic dynamics.
Indeed, phenomena such as price trends, international trade, shock transmission, and market competitiveness tend to take a back seat, despite representing essential variables for those tasked with tracking market developments. To understand these phenomena—which unfold through supply chain relationships, links to end-markets, and product substitutability—it is useful to complement chemical classifications with a map built on the economic relationships connecting the various commodities.
The classification proposed in this article represents an initial operational version, developed on the basis of more than five years of experience in analyzing chemical commodity markets. The goal is not to define a definitive taxonomy of the chemical industry, but rather to propose a working tool that can be used, verified, and progressively improved through data and market analysis.
Precisely because of its experimental and evolving nature, this classification does not replace the current commodity organization used in PricePedia, but complements it as a tool dedicated to economic analysis.

First Level: Three Major Economic Drivers
The first level of the classification divides the chemical industry into three broad areas, based on competitive market dynamics and the mechanisms through which the economic value of products is generated.
The first area is cost-based chemistry. It includes markets where prices are strongly influenced by production costs and supply-demand balances. In these markets, access to feedstocks, energy efficiency, economies of scale, logistics, and supply chain integration are key factors. These are often markets characterized by relatively standardized products, where competitive advantage depends on the ability to produce at lower costs than competitors.
The second area is value-based chemistry. In this case, product value depends not only on input costs but also on the ability to generate value for the end user. Formulation, innovation, application expertise, performance, and differentiation play a central role. In these markets, prices may be less directly linked to feedstock dynamics and more influenced by the added value that the product creates within the customer's production process or final product.
The third area is that of polymeric materials. Polymers have been isolated as an independent macro-area because they constitute an economically significant group in which both cost-based and value-based logics coexist. Some polymers are closely linked to petrochemical value chains and monomer prices; other engineering materials are instead driven by performance, specialization, and substitutability in end markets. Separating them therefore allows for a more accurate analysis of competitive dynamics and material substitution phenomena.
Second Level: Main Economic Families
The second level of the classification provides a more detailed breakdown of the three macro-areas.
Within cost-based chemistry, economic families are identified primarily based on the origin of the production chains and feedstocks. This area includes fossil and energy feedstocks, organic chemistry, inorganic chemistry, and bio-based chemistry. The logic is to follow the main feedstock transformation chains that drive the markets most sensitive to cost dynamics.
Within value-based chemistry, the classification follows the mechanisms through which value is generated for the user. This area includes formulation chemistry, fine chemistry and life sciences, dyes, and chemical fibers. In these cases, the relevant relationship is not so much the origin of feedstocks as the relationship between product, technology, and the target market.
In polymeric materials, the second level distinguishes between commodity polymers, engineering polymers, thermosetting resins, elastomers and rubbers, recycled polymers, and other plastics. The objective is to highlight areas where dynamics of substitutability, performance differentiation, and relationships with end-markets manifest.
This structure makes the classification useful at different levels of analysis. At a first level, it allows for a distinction between cost-driven and value-driven markets. At a more detailed level, it enables the identification of economic families where prices are influenced by common drivers.
The Case of Petrochemical Platforms
A particularly significant case for empirically validating the adopted classification logic is that of petrochemical platforms, which function as true "economic hubs". This family groups together platforms that develop around a product, or a group of basic products, from which relatively autonomous transformation chains originate. Specifically, the classification identifies five platforms:
- Ethylene chemistry
- Propylene chemistry
- Benzene chemistry
- C4 chemistry
- Methanol chemistry
The hypothesis to be tested in order to demonstrate the economic benefits of classification is that commodities belonging to the same platform are characterized by a stronger common economic factor than that which links commodities belonging to different platforms.
To test this hypothesis, a Principal Component Analysis (PCA) was conducted on the prices of the 50 commodities belonging to the five platforms. The objective of the PCA was to extract a synthetic factor capable of representing the dominant common economic component within the prices of each group.
If the classification is effective, the share of variance explained by the first principal component (PC1) of the individual platforms should be systematically higher than that obtained when considering the entire set of 50 commodities belonging to the petrochemical platforms (Global PC1). In economic terms, this result would indicate that commodities classified within the same platform share a relatively strong common economic factor, consistent with the existence of supply chain relationships and platform-specific price transmission mechanisms.
Results
The Global PC1 explains 69.2% of total variance. This is a high value, indicating the presence of a highly significant common petrochemical dynamic. In other words, even before considering the specific characteristics of individual platforms, petrochemical commodity prices appear to be driven by a shared sector-wide component.
Starting from this benchmark, however, the individual platforms display different behaviors, as shown in the table below.
Summary Table of PCA Results and Correlations
| Platform | Sample Size | Average Corr. | PC1 | A-B | ||
|---|---|---|---|---|---|---|
| Commodities | Observations | Platform (A) | Overall (B) | |||
| Methanol Chemistry | 5 | 113 | 0.75 | 79.7 | 69.2 | +10.5 |
| Benzene Chemistry | 15 | 113 | 0.77 | 79.3 | 69.2 | +10.0 |
| Propylene Chemistry | 13 | 113 | 0.71 | 73.9 | 69.2 | +4.7 |
| C4 Chemistry | 6 | 113 | 0.61 | 68.4 | 69.2 | −0.8 |
| Ethylene Chemistry | 11 | 113 | 0.55 | 62.6 | 69.2 | −6.6 |
The PC1 calculated for methanol, benzene, and propylene chemistry shows a greater ability to explain price variance than the benchmark. The only exceptions are C4 chemistry and ethylene chemistry, which display explanatory power similar to or lower than the benchmark, respectively.
In particular, benzene chemistry represents the clearest case of an internally homogeneous platform characterized by very strong economic relationships among prices. This is evidenced both by the high average within-platform price correlation of 0.77 and by the ability of PC1 to explain nearly 80% of the observed variance.
Ethylene chemistry represents the opposite case, namely a platform composed of more heterogeneous commodities in which the internal common factor is relatively less pronounced. Indeed, this platform records the weakest results both in terms of average within-platform price correlation, equal to 0.55, and in terms of the explanatory power of PC1, which accounts for only 62.6% of the variance.
The following chart illustrates how the PC1s of the two platforms with the most significant shared economic component — methanol chemistry and benzene chemistry — evolve differently over time.
PC1 of Benzene Chemistry and Methanol Chemistry

This result highlights the economic relevance of the classification, as it demonstrates the existence of significant divergences between the two factors, attributable to specific supply chain relationships and price transmission mechanisms.
In summary, two profiles emerge: the first consists of highly coherent platforms that are strongly aligned with their internal common economic component, such as benzene chemistry, methanol chemistry, and, to some extent, propylene chemistry; the second consists of more internally heterogeneous platforms that are more closely linked to the global petrochemical economic factor, such as ethylene chemistry and C4 chemistry.
A Classification to Use and Improve
The analysis of petrochemical platforms shows that the economic classification holds tangible analytical value. Methanol, benzene, and propylene chemistry exhibit a stronger common factor than the global petrochemical factor. Ethylene and C4 chemistry, on the other hand, display more complex dynamics, suggesting the need for further investigation.
This result is consistent with the very nature of the classification. An economic classification should not be regarded as a static and definitive list, but rather as a working tool to be tested against data, compared with market experience, and improved over time.
Its value lies not only in organizing commodities, but also in making price relationships more understandable. Where the common factor is strong, the platform can be interpreted as a cohesive value chain. Conversely, where the common factor is weak, the classification helps identify areas where sub-groups, specific analyses, or more targeted benchmarks may be required.
This new map therefore represents a tool for linking prices to supply chains and markets, interpreting shocks, building more coherent benchmarks, and potentially developing new indices capable of describing chemical market trends more directly.

You may be interested in:
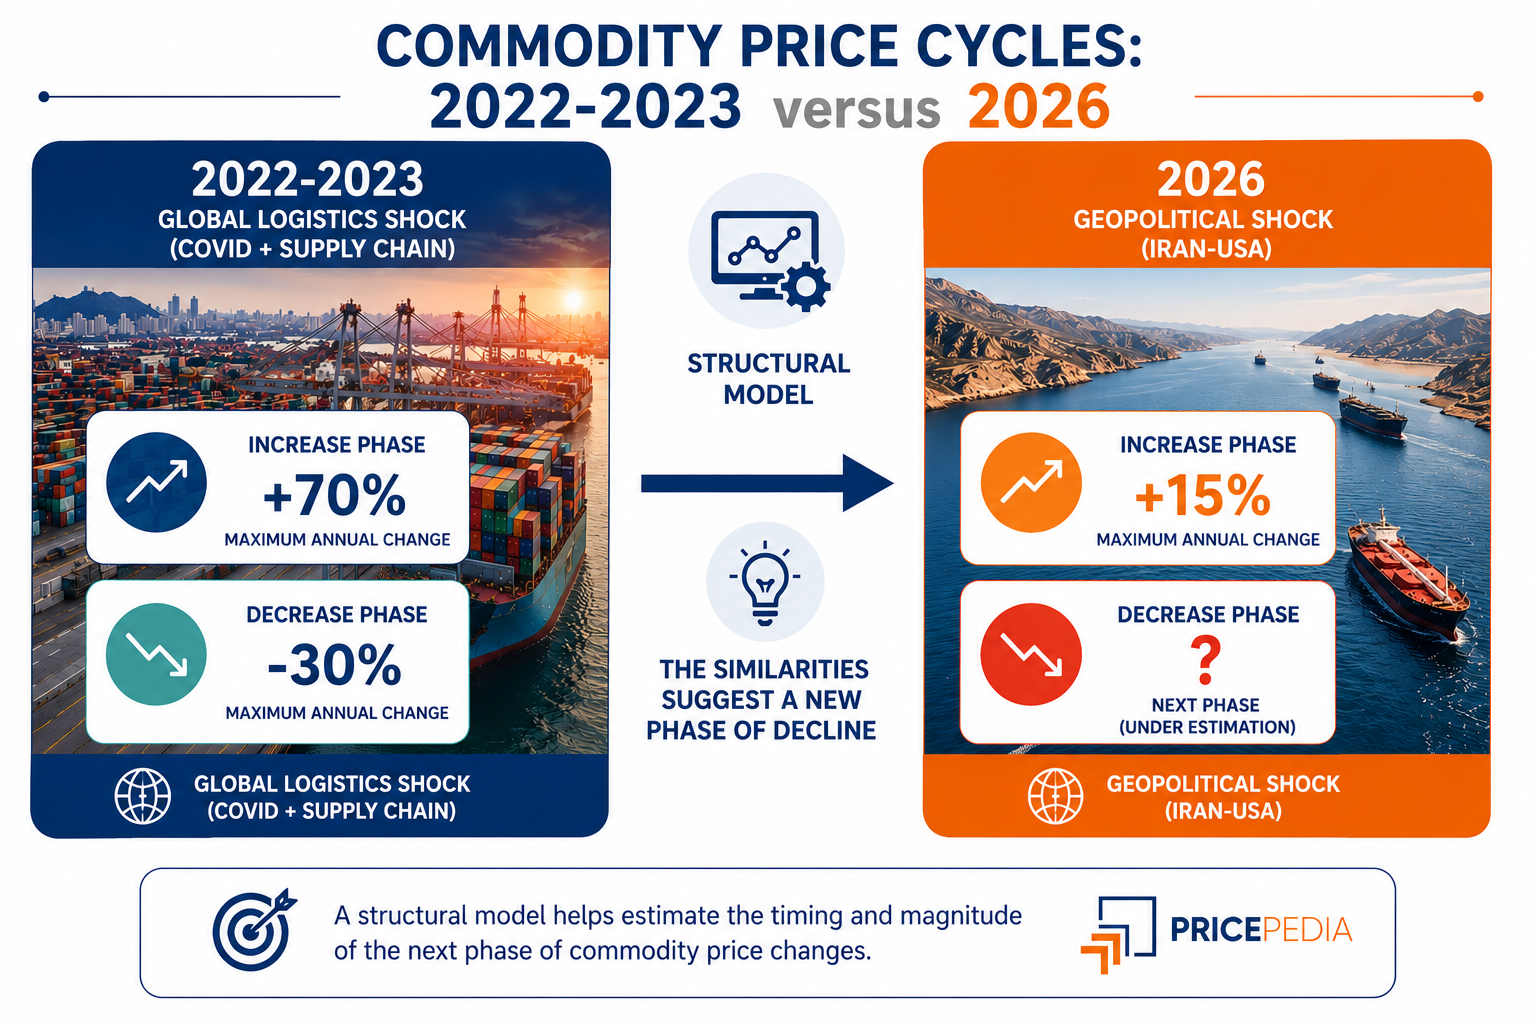
From the 2022-2023 Commodity Cycle to 2026: Insights from Structural Models
Published by Luigi Bidoia. .
Organic Chemicals Petrolchimica Strait of HormuzIl confronto tra i due shock energetici consente di stimare quali commodity potrebbero registrare le maggiori riduzioni di prezzo nei prossimi mesi [ Read all ]
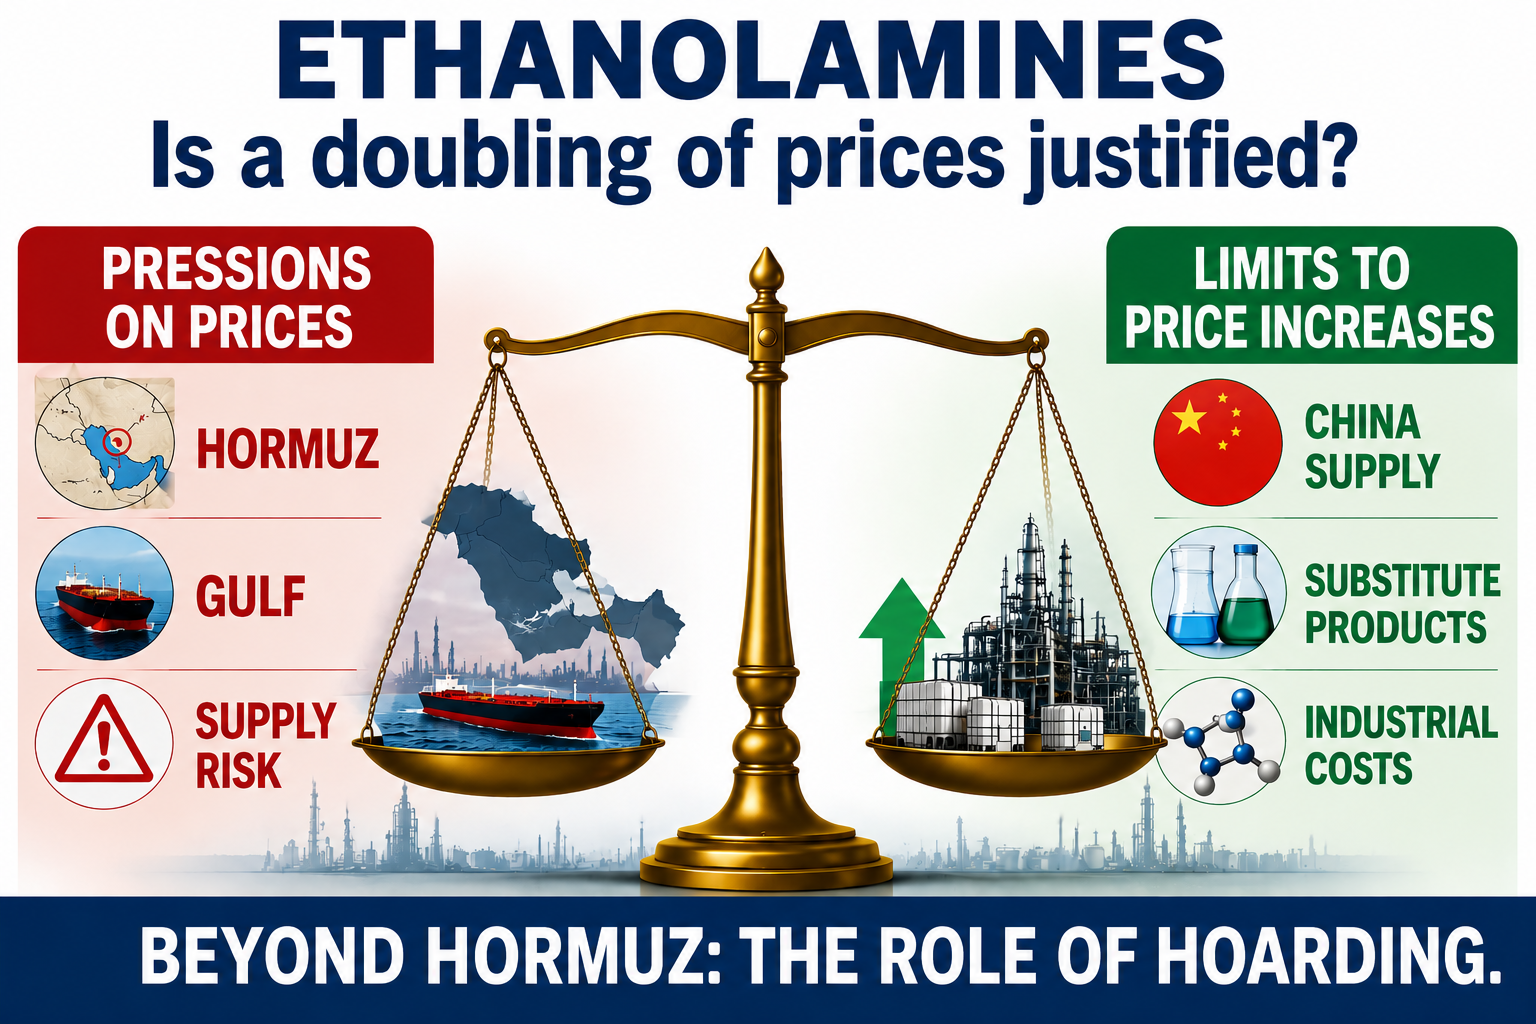
Ethanolamines: Between Market Fundamentals and Supply Concerns
Published by Daniel Vito Lobasso. .
Petrolchimica economic analysis Strait of HormuzGli aumenti di prezzo sono realmente giustificati dal rischio di blocco dello Stretto di Hormuz? [ Read all ]
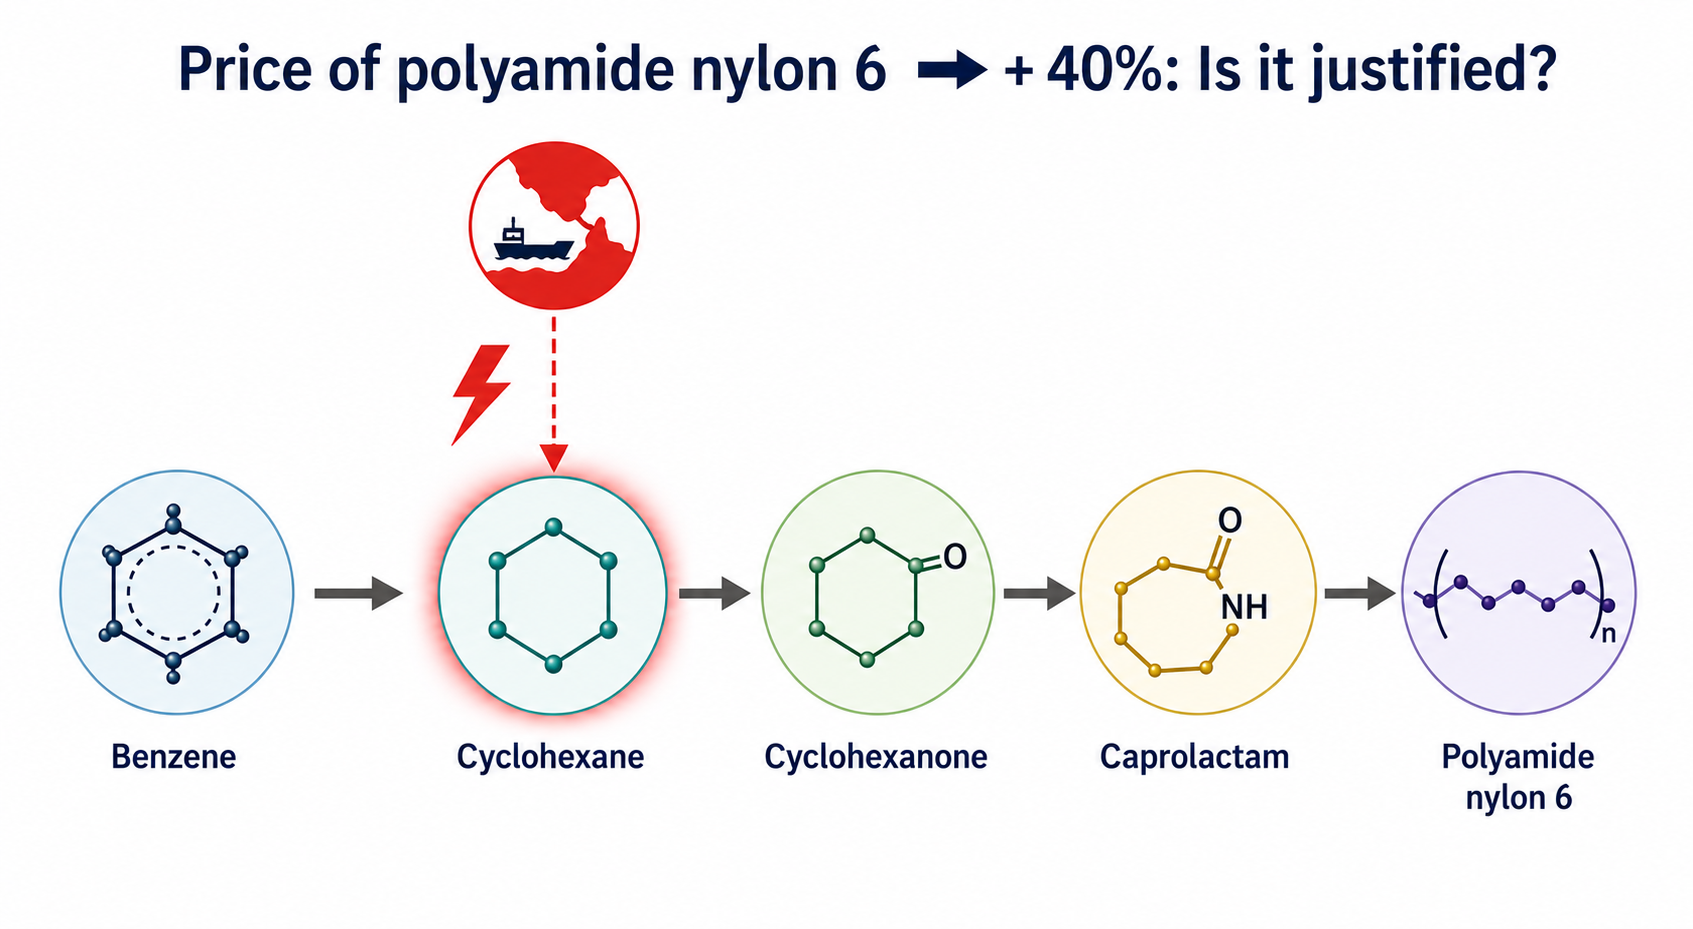
From the Physical Supply Chain to the Economic Structure of the Value Chain
Published by Luigi Bidoia. .
Organic Chemicals Petrolchimica Strait of HormuzL'impatto della chiusura dello Stretto di Hormuz sulla filiera benzene-nylon [ Read all ]