Iodine: concentrated supply and a single global price
The comparison across different geographical areas highlights a common pricing dynamic
Published by Pasquale Marzano. .
Inorganic Chemicals Price DriversIn a previous article, it was shown that the iodine market is characterized by a highly concentrated supply, driven by the fact that Chile accounts for almost 60% of global production. If countries such as Japan and the USA are also included, this share rises to around 90% of global output.
The chart below shows the evolution of global iodine production, excluding the USA[1], over the period 2000–2025 (based on USGS data).
World iodine production (ex. USA), in tonnes (USGS source)

Over the last 26 years, iodine production has grown at an average annual rate of 2.3%, increasing from nearly 20 000 tonnes to approximately 34 000 in 2025. In recent years, however, this growth has not been sufficient to offset the strong demand that has emerged, particularly from sectors such as pharmaceuticals and medical diagnostics, where iodine is almost irreplaceable.
Against a highly concentrated supply structure — as well as its rigidity, described in the article From iodine to its salts: a market dominated by a single element — international iodine demand is more geographically dispersed, with a strong contribution from Asia, Europe, and North America.
The map below shows iodine imports, in kg, by country over the 2024–2025 period (source: ExportPlanning).

Overall, Asia (blue area) represents the largest global importer of iodine, led by China and India, which rank first and third respectively among individual countries. The EU Europe region (orange area) is the second-largest global importer in aggregate terms, although at country level the third-largest importer is Norway, which belongs to the Non-EU Europe area (green). The United States also stands out: in addition to being among the main global producers, it ranks fourth among individual importing countries. Imports in other geographical areas are significantly more limited.
Do you want to stay up-to-date on commodity market trends?
Sign up for PricePedia newsletter: it's free!
Highly integrated global prices
The concentration of production in a very limited number of countries, combined with the dependence on imports by major consuming countries, supports a high degree of international price integration.
This integration can be observed by comparing physical prices in the main global consumption areas, represented by CIF customs quotations for China, the USA, and the EU, with those of producing countries, represented by FOB customs prices for Japan and the USA.

As shown in the chart, prices across different geographical areas display a common dynamic. In the current phase, iodine prices continue to move sideways, around the historical peak levels recorded in 2022, indicating that the market has not yet recovered more favorable supply conditions, despite production growth in recent years.
In terms of levels, it is useful to distinguish between CIF and FOB prices: CIF prices appear broadly aligned across different destination areas, indicating a substantial convergence in prices across major importing markets.
Alignment in price levels is also evident when comparing FOB prices for Japan and the USA. Moreover, FOB prices are on average lower than CIF prices, consistent with their different nature. CIF prices include, in addition to the commodity price, transport costs to the importing country’s customs border and insurance costs.
Such elevated prices (around five times higher than at the beginning of the decade) represent a strong incentive for increased production and make a gradual price adjustment scenario plausible, similar to what occurred in the 2012–2017 period.
1. US production data are not available as figures have been withheld by the USGS to avoid disclosure of confidential data from the producing company.
You may be interested in:
Sulphuric acid: the suspension of chinese exports tightens an already fragile market
Published by Daniel Vito Lobasso. .
Inorganic ChemicalsIl calo dell’offerta cinese accentua le tensioni sui prezzi e i rischi di approvvigionamento [ Read all ]
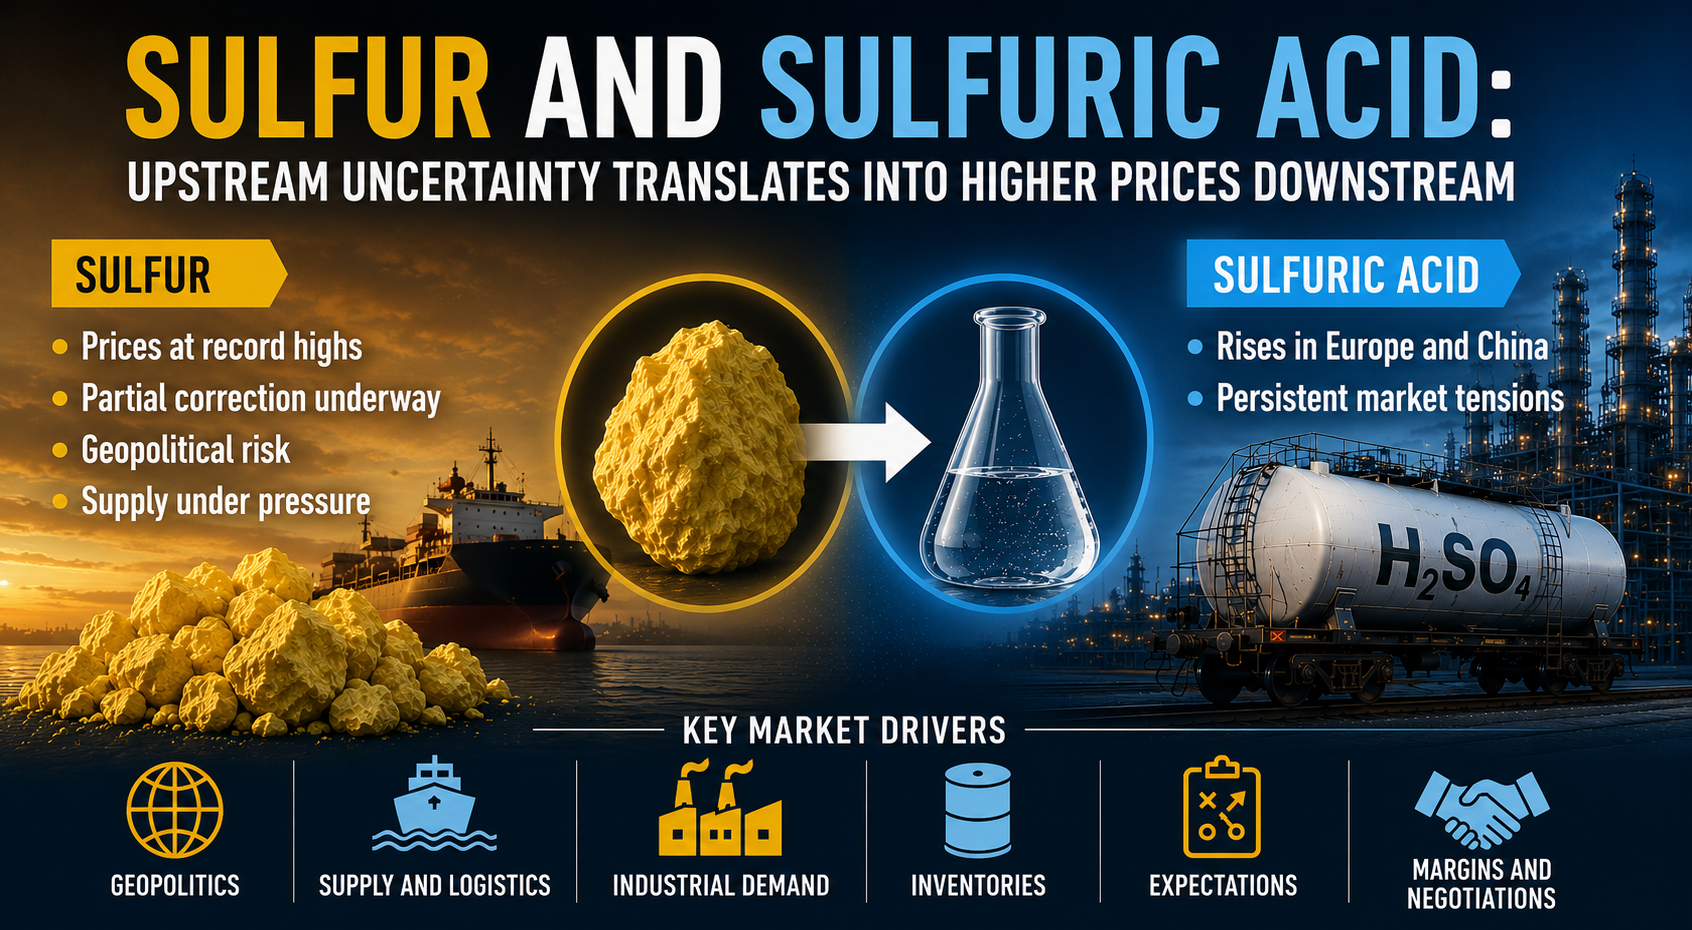
Sulfuric Acid: Sulfur Sets the Price
Published by Daniel Vito Lobasso. .
Inorganic Chemicals Strait of HormuzIl ribasso dei prezzi OTC cinesi dello zolfo dopo il parziale sblocco dello Stretto di Hormuz segnala un alleggerimento del premio geopolitico [ Read all ]
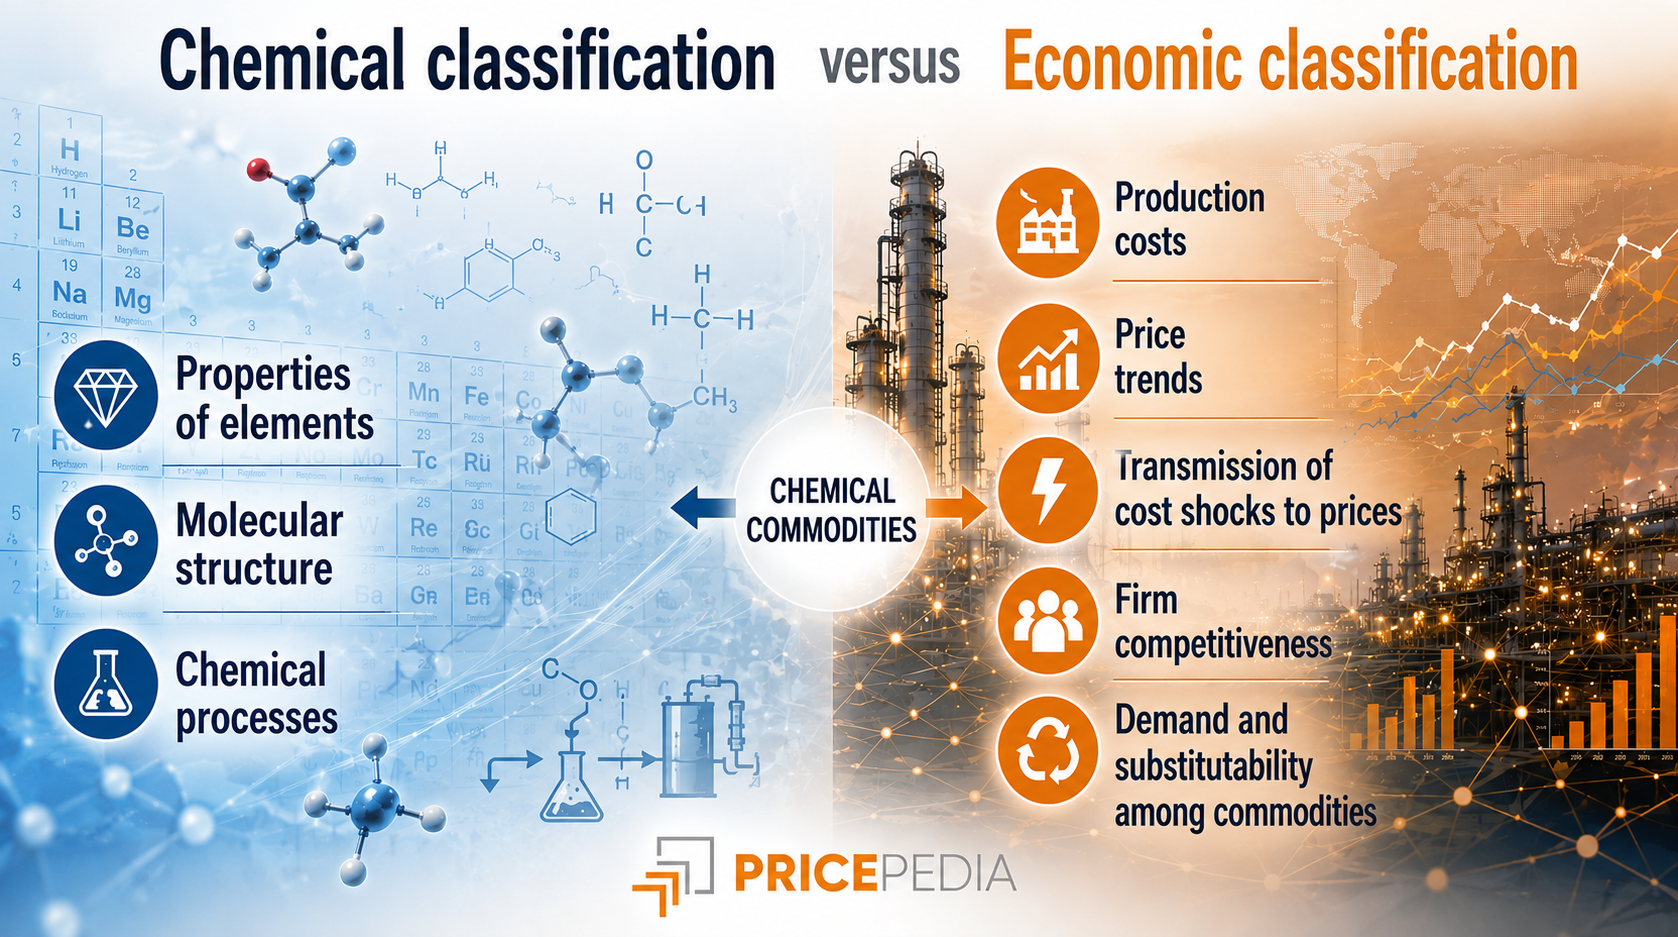
An Economic Classification of the Chemical Industry
Published by Daniel Vito Lobasso. .
Organic Chemicals Specialty chemicals Inorganic Chemicals Petrolchimica Analysis tools and methodologiesLa mappa per l’analisi dei prezzi: dalle relazioni chimiche alle relazioni economiche [ Read all ]