China's leadership in the global silk market
Analysis of the link between Asian and European silk markets
Published by Luca Sazzini. .
Textile Fibers Price Drivers
Silk is a natural textile fibre of animal origin, mainly obtained from the cocoons of the silkworm (Bombyx mori). It is distinguished by its fine fibres, lustre, lightness and strength, characteristics that make it one of the most valuable raw materials in the textile industry.
The production chain comprises several stages, from silkworm rearing to the production of raw silk, followed by its processing into yarns and fabrics primarily intended for high-end clothing and furnishings.
Silk production and supply are highly concentrated in China, which represents the world's leading reference point. This position is rooted in a thousand-year-old production tradition that has accompanied the development of international silk trade, giving rise to the famous Silk Road.
Throughout the twentieth century, the sector underwent a gradual process of industrialisation, supported by public policies, the expansion of silkworm farming and the development of processing activities. Subsequent economic reforms and progressive trade liberalisation further strengthened the Dragon Country's role in international silk markets.
Today, China's leadership extends across most of the silk value chain, from cocoon and raw silk production to the subsequent stages of spinning, weaving, dyeing and finishing. Control over the various production stages makes China a key player both in the raw material market and in the higher value-added textile products market.
Silk is traded on international markets in various forms, reflecting the different stages of processing along the value chain, from raw materials to finished textile products.
This analysis focuses on the initial stages of the value chain, examining global trade flows of raw silk, silk waste and silk yarn, the main product categories through which silk is traded as a raw material and semi-finished product. The corresponding prices in the world's main economic regions will then be analysed.
Analysis of Global Trade
The following chart shows the world's top three silk-exporting countries in 2025, with exports broken down into the three product categories covered by this analysis.
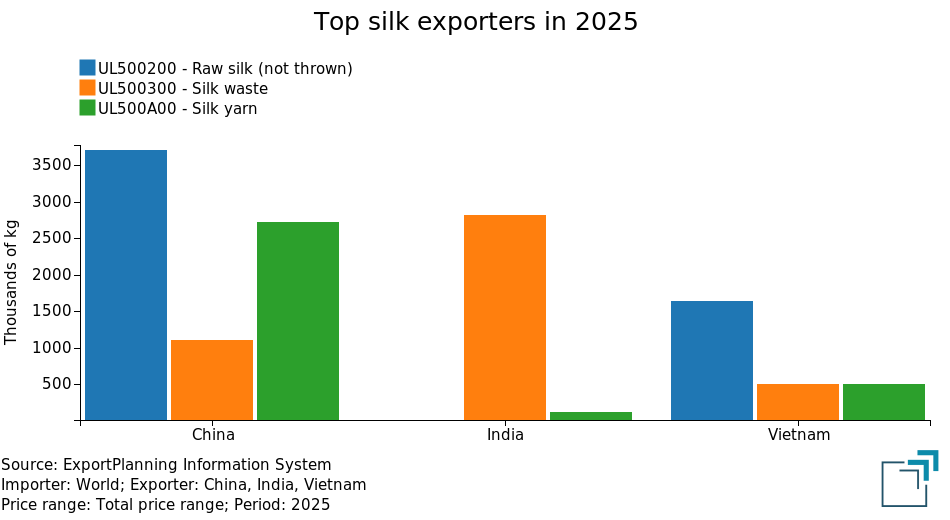
The chart highlights China's leading position in the international markets for raw silk and silk yarn, where the country ranks first among global exporters, well ahead of the other two leading suppliers. In 2025, Chinese exports reached 3.7 million kg of raw silk and 2.7 million kg of silk yarn, accounting for 48% and 55% of global exports in the two categories, respectively.
China's leadership does not extend to the silk waste market, where India is the world's leading exporter. In 2025, India exported 2.8 million kg of silk waste, with this category accounting for almost all of its silk exports. India's position is diametrically opposed in the raw silk market, where its exports are virtually negligible. India is, in fact, the world's leading importer of this raw material, with imports amounting to 2.4 million kg in 2025, equivalent to approximately 36% of global imports.
Vietnam's exports, by contrast, are mainly concentrated in raw silk, with 1.6 million kg exported in 2025. Silk waste and yarn volumes are considerably lower, standing at around 500,000 kg each.
Given China's leading position in the global silk market, Chinese prices can reasonably be expected to influence prices in other international markets.
Do you want to stay up-to-date on commodity market trends?
Sign up for PricePedia newsletter: it's free!
Analysis of International Silk Prices
An initial exploratory analysis to investigate the potential relationship between Chinese and, more broadly, Asian prices and those in the European market involves comparing the respective time series through correlation analysis. The comparison can be performed by considering both values relating to the same period and those relating to different periods.
An increase in correlation when time lags are introduced may suggest that price changes in one market precede those in the other, providing an initial indication of the possible transmission of price movements across markets.
For raw silk, the main international benchmarks are China's export prices (FOB), as the leading exporting country, and India's import prices (CIF), as the leading importing country. Since most Indian imports originate from Vietnam, India's CIF price can be used as a proxy for Vietnamese silk prices on international markets. The following table shows the correlation matrix between European raw silk prices and the corresponding Asian prices, considering both values relating to the same period and those relating to different periods.
Raw Silk Price Correlation Matrix
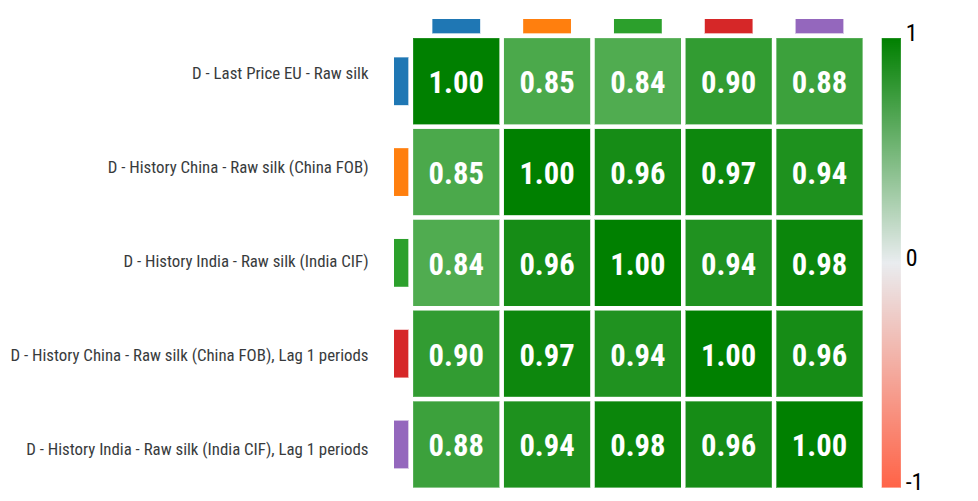
The correlation matrix shows that the correlation between Chinese and European prices increases from 0.85 to 0.90 when a one-period lag is applied to Chinese prices. The same result emerges from the comparison with Indian prices, whose correlation with European prices rises from 0.84 to 0.88 when a one-period lag is introduced. These results suggest that price movements in Asian markets may precede those in the European market.
The relationship between the three markets is further supported by a comparison of their respective price levels. The following table reports the average annual silk prices recorded by European customs, compared with those of the main international benchmarks.
Table of Average Annual Silk Prices, Expressed in Euros per Tonne
| 2021 | 2022 | 2023 | 2024 | 2025 | 2026 | |
|---|---|---|---|---|---|---|
| Raw Silk | ||||||
| European Prices | ||||||
| D-Last Price EU – Raw Silk | 54966 | 65527 | 61647 | 64812 | 64732 | 63584 |
| International Prices | ||||||
| D-Historical China – Raw Silk (China FOB) | 48958 | 60099 | 57150 | 63135 | 58103 | 54146 |
| D-Historical India – Raw Silk (India CIF) | 43490 | 55333 | 54989 | 58165 | 54327 | 52209 |
| Silk Waste | ||||||
| European Prices | ||||||
| D-Last Price EU – Silk Waste | 27943 | 30200 | 41006 | 42757 | 40974 | 38546 |
| Silk Yarns | ||||||
| European Prices | ||||||
| D-Last Price EU – Unprocessed Silk Waste Yarns | 47626 | 60850 | 61189 | 68126 | 72951 | 76110 |
| D-Last Price EU – Processed Silk Waste Yarns | 38826 | 47426 | 51513 | 51758 | 50068 | 53605 |
| D-Last Price EU – Unprocessed Silk Yarns | 61194 | 75326 | 77877 | 78421 | 81612 | 80547 |
| D-Last Price EU – Processed Silk Yarns | 53129 | 63436 | 73220 | 90743 | 86704 | 91640 |
| International Prices | ||||||
| D-Historical China – Silk Yarns (China FOB) | 46690 | 59467 | 60757 | 59252 | 58356 | 58042 |
Over the past six years, raw silk prices in the three regional markets have followed similar annual trends, remaining at relatively close levels, although some differences between geographical areas have persisted. In particular, the European market has consistently recorded the highest price levels, while the Indian market has been characterised by the lowest prices.
A notable difference emerges from the comparison between raw silk and silk waste, which consists of fibrous residues recovered during the various processing stages. Silk waste prices are more than €2,000 per tonne lower than raw silk prices. This gap persists through the subsequent stages of the value chain, with differences varying according to the degree of processing of the product.
In the European market, the price differential between yarns made from silk waste and those derived from raw silk is approximately €1,000 per tonne, while it exceeds €2,500 per tonne for processed products.
Conclusions
The analysis highlights China's leading position in the global silk market. The country is the world's largest exporter of both raw silk and silk yarn, accounting for 48% and 55% of global exports, respectively.
China's dominant position on the supply side also gives it considerable influence over international price formation. The correlation analysis further suggests that price movements in China and India tend to precede those observed in Europe. This relationship could be confirmed in a subsequent study through regression analysis, in order to assess the extent to which Asian prices help explain variations in European prices.
You may be interested in:
How thermoplastic polymer prices are transmitted along synthetic fibre value chains
Published by Pasquale Marzano. .
Polypropylene Textile Fibers Polyamide Polyethylene terephthalate (PET) Price DriversThe case of nylon, polypropylene and polyester [ Read all ]

Cashmere market risk
Published by Luca Sazzini. .
Textile Fibers Wool Price DriversDependence of world cashmere supply on China [ Read all ]
Cotton: interconnection between financial and physical prices
Published by Luca Sazzini. .
Cotton Textile Fibers Price DriversCotton financial prices anticipate customs price dynamics [ Read all ]