HRC futures curve: analysis of the evolution of market expectations
What is the impact of the EU's proposed safeguards on HRC futures prices?
Published by Luca Sazzini. .
Hot-Rolled Coils HRC Analysis tools and methodologiesIn the Daily Data Prices section of the PricePedia website, the possibility to view the futures curve of financial prices has recently been introduced. The futures curve allows users to analyse, on a given day, the prices by maturity of the various futures: on the x-axis are the contract maturity days/months, while on the y-axis are the futures prices on the selected date. To choose the price observation date, after clicking the “futures curve” button, a calendar will appear on the right side of the chart, allowing users to select the day for which they want to view the curve. It is also possible to select multiple dates at once, in order to compare the dynamics of the futures curve across different periods.
In most cases, the futures curve shows an upward trend, because futures with longer maturities tend to have higher prices than short-term ones, with a spread equal to storage and financial costs[1]. If the differential between the two prices were to become higher than the storage and financial costs, arbitrageurs could buy the commodity in the short term, define a futures contract for a later maturity at a price higher than the spot + storage and financial costs, and physically hold the goods in storage until delivery on the futures contract maturity date. In this way, they would obtain a net profit equal to the difference between the futures price and the sum of the spot price and storage and financial costs.
In the opposite situations, i.e., when futures prices decrease as maturity increases, the market is anticipating a drop in prices in the near future. This setup reflects a present scarcity that market participants consider temporary. Since the causes of the shortage are not expected to be long-lasting, the market anticipates an increase in supply in the following months and, consequently, lower prices for longer maturities.
Another particularly effective use of the futures curve is the ability to compare curves from different points in time, allowing analysis of how financial market expectations have changed over time.
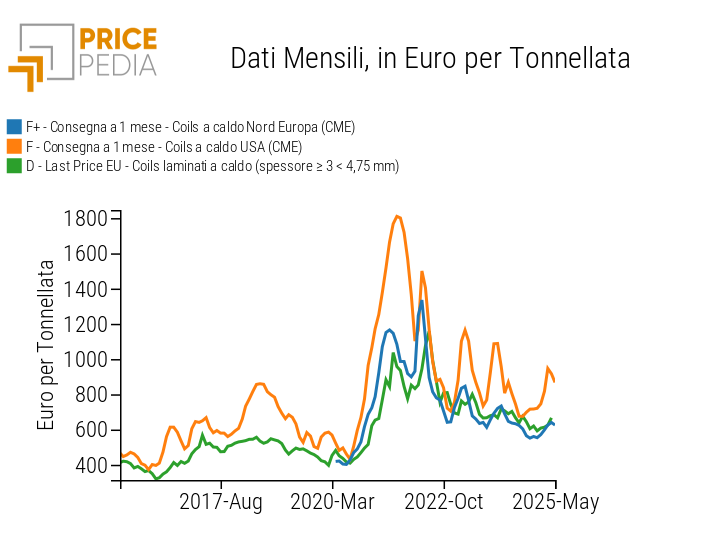
In this article, we will analyse an example given by the futures curve of North European coil prices, listed on the Chicago Mercantile Exchange (CME). The example illustrates how the market reacted to last month’s announcement by the European Commission, aimed at strengthening protection of the steel sector in the face of global overcapacity.
Effect of EU proposed protection measures on the HRC futures curve
On October 7, the European Commission presented a new protection plan for the steel sector, aimed at ensuring the competitiveness, sustainability, and decarbonisation of the European industry. The new proposal is expected to replace the current safeguard regime expiring in June 2026. The new plan foresees a 47% reduction in duty-free import volumes, bringing them to 18.3 million tonnes per year, and a doubling of the out-of-quota tariff from 25% to 50%. In addition, a Melt and Pour traceability obligation will also be introduced, allowing certification of the steel’s origin and identification of both the melting location (Melt) and the casting location (Pour), countering evasive practices and increasing market transparency.
The announcement of the proposal had an immediate impact on futures prices of hot-rolled coils in North Europe listed on the Chicago Mercantile Exchange (CME). This is clearly evident from the comparison between the futures curve on October 7 and that of the previous day, as shown in the following chart.
Comparison of North European HRC futures curves, expressed in euro/tonne

The chart analysis clearly shows the change in the futures curve dynamics following the European Commission’s announcement of its intention to strengthen trade barriers in the steel sector. While the contract expiring in October 2025 increased by 10 euro/tonne, futures with maturities from June 2026 onward, when the new proposal would take effect if approved, registered double increases of 20 euro/tonne. This highlights the incorporation in financial market participants’ expectations of an effect on future coil prices due to the possible introduction of stricter trade barriers.
Conclusions
Analysis of the futures curve is particularly useful for extracting expectations on the future dynamics of a commodity’s prices and for understanding how such expectations change when new information emerges.
In the case of hot-rolled coils in North Europe, the futures curve showed significant changes following the European Union’s proposal to strengthen trade barriers to protect the steel market from global overcapacity. Longer-dated contracts saw more pronounced increases compared to the more contained rises of short-term contracts.
This trend reflects a shift in market expectations, which now places a higher value on future prices of hot-rolled coils in the European market, taking into account the greater risk associated with the potential approval of the new trade barriers.
[1] Financial costs refer to the cost of tied-up capital, which includes both the cost of borrowing and the opportunity cost associated with not investing in more profitable alternatives.
You may be interested in:

HRC: A Partially Globalized and Financialized Market
Published by Luca Sazzini. .
Ferrous Metals HRC Price DriversToward a regional division of the HRC market? [ Read all ]
Drivers of hot rolled coil prices in the 2025-2026 biennium
Published by Luca Sazzini. .
Ferrous Metals HRC ForecastWhy should the HRC price not deviate much from the average prices in 2024? [ Read all ]

Effects of US tariffs on global commodity prices
Published by Luigi Bidoia. .
Aluminium HRC Import tariffsL'insegnamento dei dazi USA del 2018 [ Read all ]