PSV as a function of futures curves and global markets: a model for estimating the price of Italian natural gas
From short-term equilibrium to adjustment dynamics: an econometric model for analysing the evolution of Italy’s main gas benchmark
Published by Martina Gallus. .
Natural Gas Price DriversA two-stage model for PSV gas price forecasting
The gas price at the Virtual Trading Point, PSV, represents the main benchmark for the gas market in Italy. Its dynamics are influenced not only by the specific conditions of the domestic market, but also by the evolution of European and global natural gas markets. For this reason, a particularly useful approach for estimating the PSV is one that integrates information coming from the European market, represented by the TTF (Title Transfer Facility, a virtual gas trading hub in the Netherlands), and from the global liquefied natural gas market, represented by the JKM benchmark (Japan Korea Marker, the main reference price for liquefied natural gas in Asian markets).
The model aims to estimate the average PSV price over the following 15 days, used as a proxy for the short-term equilibrium value, and to describe the daily dynamics through which the price moves relative to this equilibrium value, through a two-stage structure. Forecasting PSV is relevant not only for gas market analysis, but also for the construction of electricity price scenarios. In the hourly PUN model, in fact, the gas price enters as an exogenous variable in determining the variable cost of thermoelectric power plants, thus contributing to explaining a fundamental component of the wholesale electricity price.
Data description
The dataset used has a daily frequency and includes observations of the PSV price, TTF futures and the JKM future.
On days when some financial series are not quoted, missing values are filled through a forward fill procedure, assigning to those days the last available value. The table below reports the variables implemented in the model:
Variables used in the PSV model
| Variable | Description | Construction |
|---|---|---|
| PSV | Current PSV price | |
| TTF1 | 1-month continuous TTF future | |
| TTF6 | 6-month continuous TTF future | |
| JKM1 | 1-month continuous JKM future | |
| DIFF_TTF6 | TTF curve slope | TTF6 - TTF1 |
| DIFF_KT | Asian gas premium relative to TTF | JKM1 - TTF1 |
| PSV15 | First-stage target | 15-day moving average of PSV |
Model structure
The model is structured in two stages. The first stage estimates the expected average PSV value over the following 15 days. The second stage uses the value estimated in the first stage to describe the daily variation of the PSV and the return of the price towards its short-term equilibrium.
First stage
The value estimated in the first stage represents a short-term equilibrium, in the sense that it summarizes the level towards which the PSV tends based on the information incorporated in the futures market:
PSV15t = 0.5261 + 0.9979PSVt + 0.0688DIFF_TTF6t + 0.2219DIFF_KTt
| Variable | Coeff. | Std. err. | t | p-value |
|---|---|---|---|---|
| const | 0.5261 | 0.646 | 0.814 | 0.416 |
| PSV | 0.9979 | 0.011 | 87.679 | 0.000 |
| DIFF_TTF6 | 0.0688 | 0.024 | 2.888 | 0.004 |
| DIFF_KT | 0.2219 | 0.032 | 6.861 | 0.000 |
|
0.915
R²
|
0.915
Adjusted R²
|
2050
Observations
|
0.210
Durbin-Watson
|
The dependent variable is PSV15, defined as the 15-day forward moving average of the PSV price.
The regressors of the first-stage model are:
- PSV (coeff. 0.9979): The coefficient of the current PSV is positive, close to 1, and highly significant. The current PSV represents the main source of information on the average price level in the following weeks, reflecting the strong persistence typically observed in the gas market.
- DIFF_TTF6 (TTF6 - TTF1, coeff. 0.0688): This variable expresses the distance between the 6-month TTF future and the 1-month TTF future. The coefficient is positive and significant. This indicates that the TTF futures curve contains useful information for forecasting the future PSV level. A more upward-sloping TTF curve, i.e. with TTF6 higher than TTF1, signals stronger market expectations for the following months and is associated with an increase in the expected average PSV over the next 15 days.
- DIFF_KT (JKM1 - TTF1, coeff. 0.2219): Differential between the Asian and European natural gas markets. This variable also shows a positive and significant coefficient. It measures the spread between the Asian LNG gas market and the European gas market. When the JKM price is higher than the European TTF, the Asian market also exerts pressure on the European market and consequently on the Italian market, leading to an increase in the average PSV over the following 15 days.
Overall, the first stage shows good explanatory power, with a high R² indicating an excellent fit of the model to the observed data and all coefficients being statistically significant, confirming the relevance of the included variables; however, the low Durbin-Watson value indicates the presence of autocorrelation in the residuals, which is consistent with the strong persistence typically observed in gas price series.
The value estimated in the first stage, PSV15_EQ, as already mentioned, represents the estimated equilibrium value of the PSV price over a 15-day horizon.
The deviation between the current price and the estimated equilibrium value is defined as:
ERRt = PSVt - PSV15_EQt
Second stage
The second stage defines the daily dynamics of the PSV. The specification uses the variation of the equilibrium value estimated in the first stage and the lagged error term:
ΔPSVt = 1.0399ΔPSV15_EQt - 0.0499ERRt-1
where ΔPSVt = PSVt - PSVt-1 and ΔPSV15_EQt = PSV15_EQt - PSV15_EQt-1.
| Variable | Coeff. | Std. err. | t | p-value |
|---|---|---|---|---|
| ΔPSV15_EQt | 1.0399 | 0.004 | 242.823 | 0.000 |
| ERRt-1 | -0.0499 | 0.007 | -7.321 | 0.000 |
|
0.967
R²
|
2049
Observations
|
2.381
Durbin-Watson
|
5957
AIC
|
Dependent variable:
- ΔPSVt: daily variation of the current PSV.
Regressors:
- ΔPSV15_EQt (coeff. 1.0399): The coefficient is positive and highly significant. This indicates that the daily variations of the equilibrium value estimated in the first stage are transferred almost entirely, and slightly more than proportionally, to the daily variations of the PSV.
- ERRt-1 (coeff. -0.0499): The coefficient of the lagged error term is negative and significant. The negative sign is the expected result for an ECM model: when the PSV is above the estimated equilibrium value, the error term tends to generate a downward correction; when the PSV is below equilibrium, the correction tends to be positive. The coefficient value, equal to -0.0499, indicates an adjustment speed of approximately 5% per day. The result therefore suggests the presence of a return-to-equilibrium mechanism, but with a gradual correction of the imbalance.
Do you want to stay up-to-date on commodity market trends?
Sign up for PricePedia newsletter: it's free!
Forecasting use of the model
After estimating the two stages, an ex-post evaluation was carried out to assess the model's ability to reproduce the historical dynamics of the PSV. The analysis does not aim to produce real-time operational forecasts, but rather to verify the consistency of the simulated trajectories compared with the actual historical values observed.
The procedure simulates, for each day of a reference period (in this case from March 2021 to June 2026), a 15-day forecast using the complete two-stage model.
The following chart shows the comparison between the values estimated by the model and the corresponding observed values since the beginning of the year.
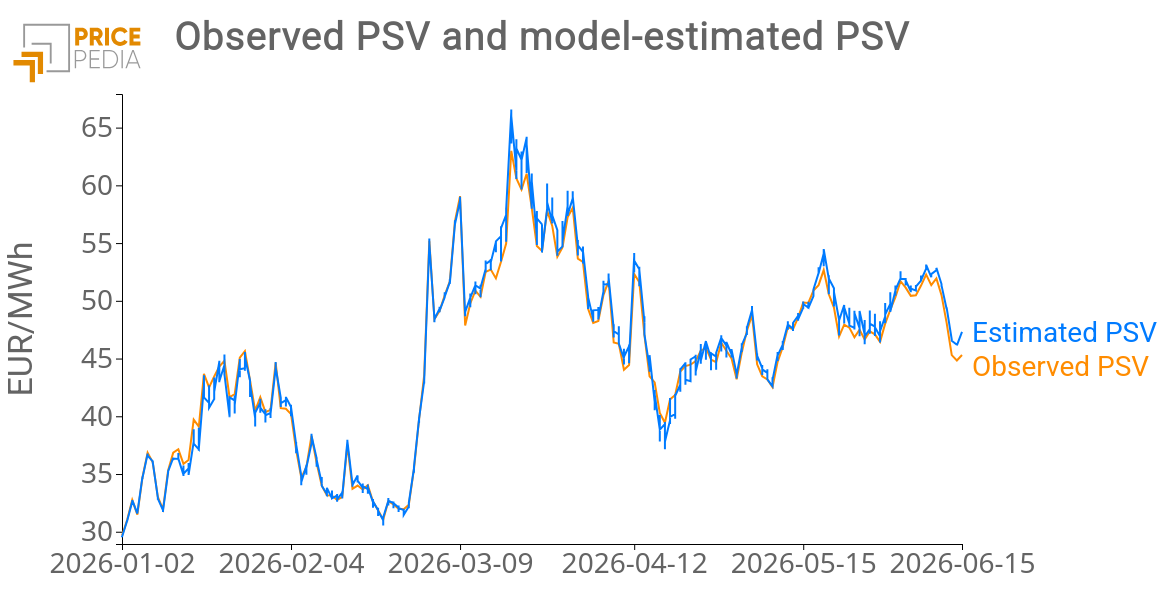
The chart highlights how the two series — observed PSV and estimated PSV — are strongly overlapping throughout the entire analyzed horizon, even during periods characterized by high volatility. The quality of the reconstruction is measured through the Mean Absolute Error (MAE): the model returns an MAE of 1.09 EUR/MWh, indicating that the generated values deviate on average by approximately one euro from the observed historical price. Considering the high volatility of the PSV during the analyzed period, the average error is limited and indicates a good ability of the model to reproduce the historical dynamics of the Italian gas benchmark.
Conclusions
The proposed model provides a synthetic and interpretable representation of the short-term dynamics of the PSV price. The first stage identifies a 15-day equilibrium value strongly anchored to the current PSV, but enriched by information coming from the TTF curve and the JKM premium relative to TTF.
The second stage shows that the daily variations of the PSV closely follow the changes in the estimated equilibrium value and that there is a statistically significant mechanism correcting deviations.
Overall, the two-stage structure makes it possible to combine the information contained in futures markets with a short-term adjustment dynamic, providing a useful tool for the development of forecasting methods and a fundamental component for an electricity price forecasting model.
You may be interested in:

The direct effects of Natural Gas on procurement materials
Published by Pasquale Marzano. .
Strumenti Natural Gas Analysis tools and methodologiesWhich products are most exposed to recent fluctuations in energy inputs? [ Read all ]

What the Numbers Really Say About Gas in Europe
Published by Luigi Bidoia. .
Natural Gas Analysis tools and methodologiesQuali grafici possono aiutare a interpretare meglio il mercato europeo del gas [ Read all ]

Global Gas Market: Towards New Equilibria
Published by Luigi Bidoia. .
Natural Gas Price DriversEuropa, Cina e Stati Uniti: l’intreccio tra mercati finanziari e fisici, GNL e gasdotti nella formazione dei prezzi [ Read all ]