Global financial markets and regional physical markets: the case of soybean
Studying the direction of causality and contamination between markets
Published by Luca Sazzini. .
Food Price DriversIn the article Financial Prices of Soy: A Cross-Elasticity Case Study, the method of statistical regression was used to explore the relationship between soybean oil prices and soybean meal prices.
This article will resume the analysis on the soybean market to first delve into the causality relationship between seed prices and soybean oil prices, and then to verify the relationship between financial prices of soy derivatives listed on the CME (Chicago Mercantile Exchange) and the DCE (Dalian Commodity Exchange).
Study of the Relationship between Oil Prices and Soybean Seed Prices
Graphical Comparison
A first method to understand which of the two prices influences the other is to observe the comparison between the two historical series to see if one price anticipates the dynamics of the other.
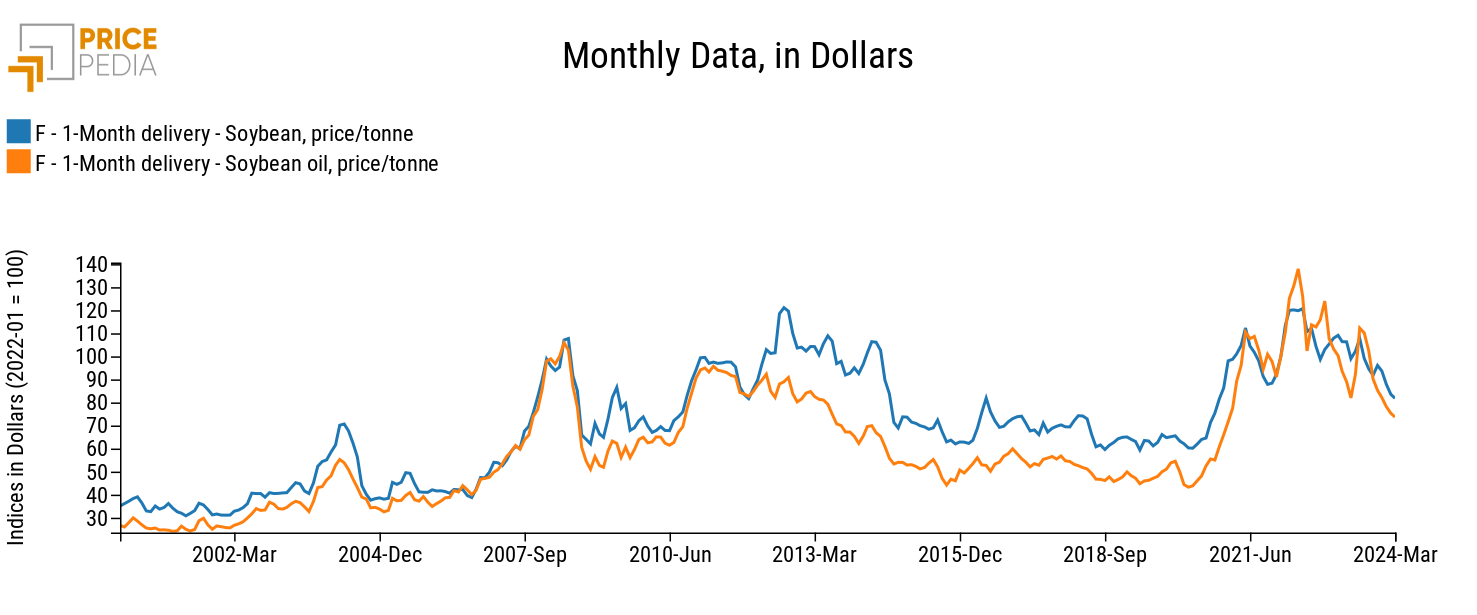
Below are the historical series of financial prices of oil and soybean seeds quoted on the Chicago Mercantile Exchange (CME).
Comparison of Financial Prices of Oil and Soybean Seeds Quoted on the CME

From the analysis of the graph, it emerges that soybean oil prices often anticipate soybean seed prices. This anticipation is particularly evident in 2022 during the outbreak of the war in Ukraine. In that historical period, in fact, soybean oil prices recorded an increasing trend following the trends of other food oils. This rise in oil prices in turn had a positive impact on soybean seed prices, which in 2022 recorded new all-time highs.
Statistical Regression
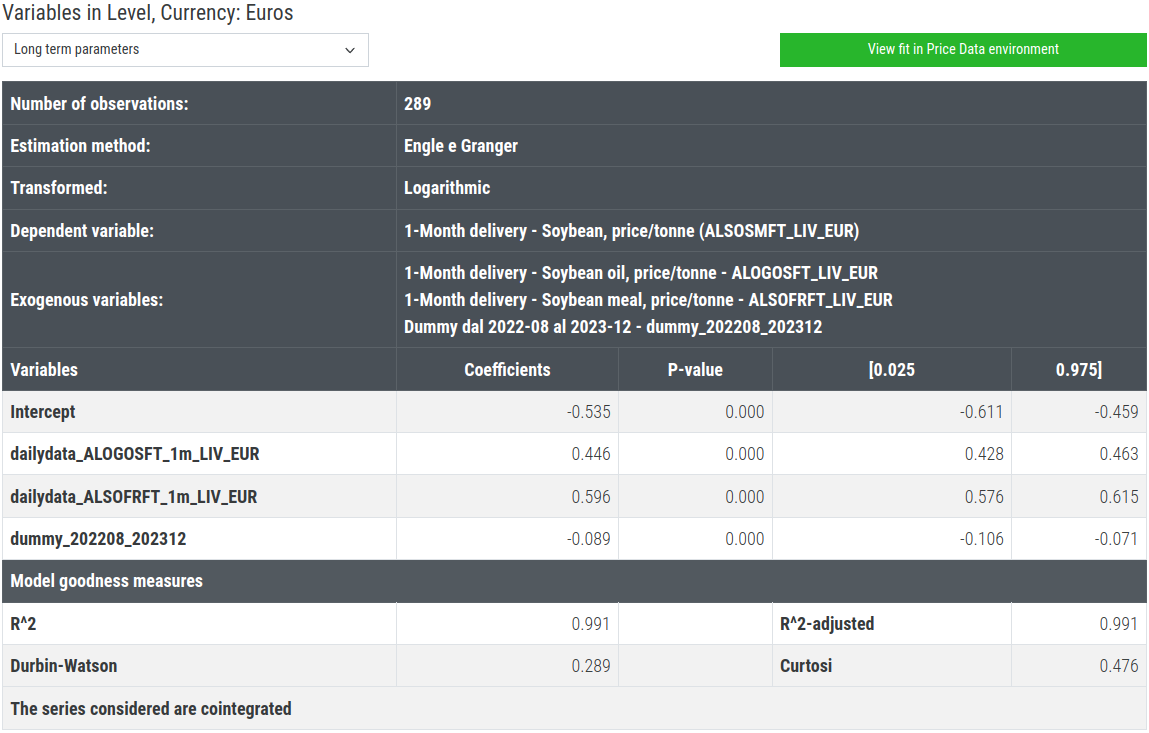
For robust statistical evidence that soybean oil prices influence soybean seed prices and not vice versa, a regression analysis is needed where soybean seed prices are regressed with oil and meal prices, considering the possible delays with which changes in oil prices may influence seed prices.
Long-Term Soybean Seed Regression Model

The regression results are excellent from a statistical point of view, with highly significant estimated coefficients and an R2 statistic close to unity.
However, the regression analysis does not provide clear indications on the cause-effect relationship between seed prices and soybean oil prices. In the model above, delays for soybean oil prices were not introduced, as adding them would have slightly reduced the efficiency of the model from a statistical point of view. It is therefore not possible to assert with certainty that it is soybean oil prices that influence derivative prices and not vice versa.
The cause-effect relationship is likely to change depending on the shocks impacting the soybean and derivative markets. If the shock affects the seed market (scarcity or abundance of a crop), the cause-effect relationship will go from seed prices to oil prices. If, on the other hand, the shock affects the oil market, for example, with a significant variation in substitute oil prices, then the cause-effect relationship will go from oil price to seed price.
This was the case at the beginning of 2022 when the invasion of Ukraine by Russia led to a sharp increase in sunflower oil prices, impacting the prices of all other seed oils, including soybean oil (confirmed by the sharp increase in sunflower prices in April 2022 of +45%).
The Global Soy Derivatives Market
The existence of quotations for soy derivatives both on the Chicago Exchange and on the DCE (Dalian Commodity Exchange) allows verification of the existence of a global market for soy derivative prices.
The issue is not trivial because at the physical level the soy market is strongly regionalized due to the tariff barriers that China has imposed on imports from the United States.
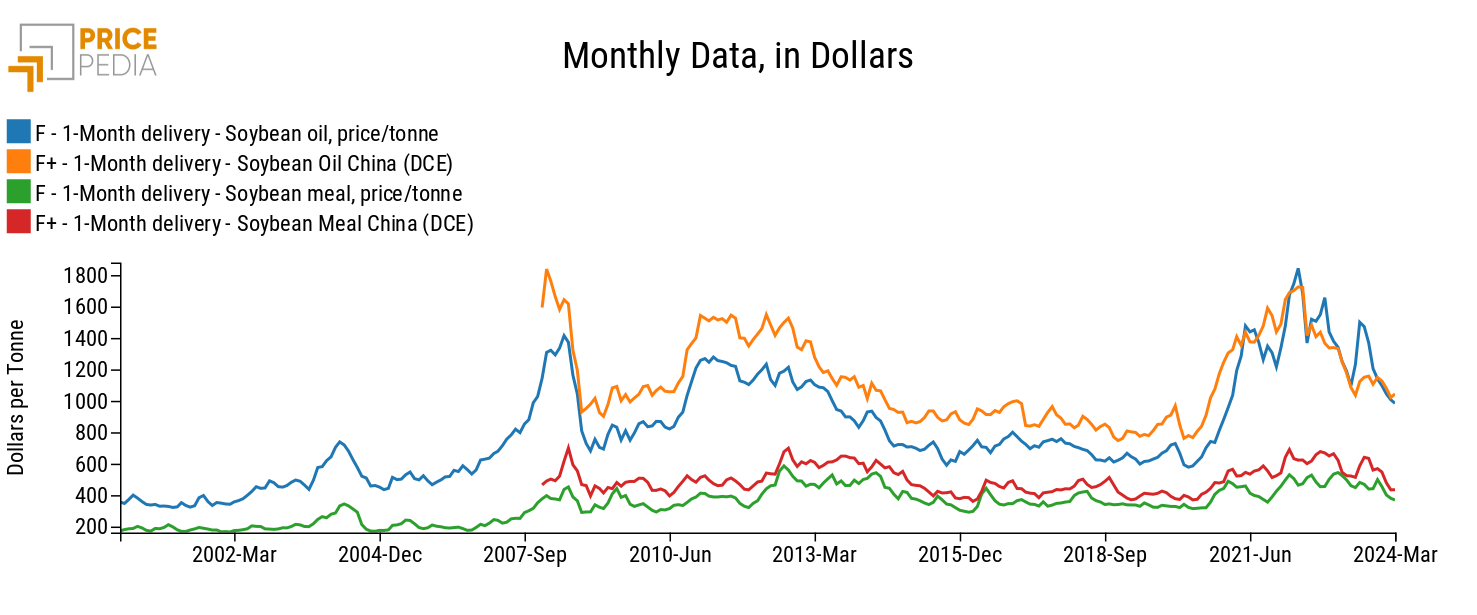
Below are comparisons of U.S. financial prices and Chinese financial prices for soybean oil and soybean meal[1].
Comparison of Financial Prices of Soy Derivatives Quoted on the CME and DCE

The graph highlights a strong correlation between the financial prices of soy derivatives. However, two important characteristics emerge among the correlations of soy derivatives:
- Soybean oil prices are more correlated than soybean meal prices.
- The correlations between financial prices of derivatives quoted on the two different exchanges have decreased in recent years. For soy oils, the correlation between the two financial prices between January 2002 and January 2022 is 0.97, while the correlation from January 2022 to date is 0.65. For soybean meal, the correlation changes from 0.84 to 0.41, again from January 2022.
Impact of the Global Soy Financial Market on European Physical Prices
The presence of a global financial market for soy prices, in addition to influencing the prices of various financial exchanges, can heavily impact the dynamics of physical prices. In the case of soy, in fact, financial prices quoted on various exchanges anticipate the dynamics of physical prices recorded at European customs. It may therefore be useful to study how strong the impact of financial prices is on their respective physical prices.
Below is a table showing the estimated elasticity coefficients between European customs prices for soy and their respective financial prices quoted on the Chicago Mercantile Exchange.
Soy Market: Elasticity between European Customs Prices and U.S. Financial Prices
| Soy Prices | Elasticity between Physical and Financial Prices |
| Soybeans | 0.93 |
| Soybean Meal | 0.84 |
| Soybean Oil | 0.89 |
The above elasticities are the results of 3 different long-term regressions where European customs prices for soy were regressed against their respective financial prices quoted on the CME.
From the results of the 3 regression models, it emerged that soy financial prices are excellent explanatory variables to explain the trends of their respective European customs prices. The above reported elasticities are all significant and are characterized by values very close to unity, meaning that the variation in financial prices is almost entirely transmitted to physical prices. In particular, a 10% change in soybean financial prices results in a positive change in European soybean customs prices of approximately 9.3%.
Therefore, it becomes important to follow the trends of soy financial prices to accurately anticipate the future dynamics of European physical prices in the soy market.
Conclusions
From the regression analysis between soybean oil prices and soybean seed prices, a clear direction of causality did not emerge.
The soybean financial market has proven to be a global market, although in the recent historical period the correlation between prices quoted on different exchanges has decreased. The elasticity between European customs prices and financial prices is very high, with financial prices tending to anticipate the dynamics of European customs prices.
[1] Soybean seed prices are not included in the graph as they are not quoted on the Dalian Commodity Exchange.


