PricePedia Scenario for February 2026
Commodity prices: diverging dynamics across macro-categories
Published by Pasquale Marzano. .
Forecast ForecastIn the PricePedia Scenario, updated with information available as of 5 February 2026, the downward trend in raw material prices for the 2026-2027 biennium is confirmed, reflecting weak global commodity demand, in line with what was reported in the previous update.
This context is illustrated in the chart below by the trend of the global industrial cycle[1], developed by PricePedia on the basis of global industrial production dynamics.
Global industrial cycle, February 2026 scenario

Compared with the previously published scenario, the industrial cycle is expected to record less pronounced growth rates both in 2026, with a contraction of around -1%, and in 2027, with growth remaining below 0.5%, highlighting the absence of significant tensions between commodity demand and supply.
The price outlook for input materials
Weak fundamentals, as reflected in the dynamics of the global industrial cycle, translate into generally subdued price trends for purchased materials, albeit with differences across product categories.
The expected price trends are shown in the table below, which reports annual changes in euro terms for the main commodity aggregates included in the PricePedia Scenario: Industrial[2], Commodity[3], Energy and Food.
Table 1: Annual rates of change (%) of PricePedia Aggregate Indices, in Euro
| 2024 | 2025 | 2026f | 2027f | |
|---|---|---|---|---|
| I-PricePedia Scenario-Commodity Index (Europe) (05-02-2026 Info) | -4.00 | -4.88 | -6.32 | -2.06 |
| I-PricePedia Scenario-Energy Total Index (Europe) (05-02-2026 Info) | -6.11 | -12.10 | -12.66 | -4.64 |
| I-PricePedia Scenario-Industrials Index (Europe) (05-02-2026 Info) | -4.59 | -2.96 | +1.04 | +2.33 |
| I-PricePedia Scenario-Food Total Index (Europe) (05-02-2026 Info) | +9.29 | +17.40 | -12.23 | -7.30 |
Against the backdrop of the expected decline in the total commodity index, a gradual differentiation across individual commodity macro-categories emerges: on the one hand energy and food commodities, and on the other core industrial commodities.
The former are expected to post price declines of more than -12% in 2026, following the elevated levels reached in previous years. Prices are forecast to continue falling in 2027 as well, albeit at a slower pace. For both categories, the downward trend is linked to an improvement in supply conditions compared with the recent past.
In the case of industrial commodities, by contrast, a moderate price recovery is expected: after bottoming out during 2025, prices are forecast to increase by around +1% in 2026. In 2027, growth is expected to settle at approximately +2% on an annual average basis.
While, in aggregate terms, industrial commodity prices are expected to remain generally subdued, with modest increases, sharper price rises at the level of individual input materials cannot be ruled out, as in the case of copper and sulphur and their derivatives.
Price forecasts along the value chain
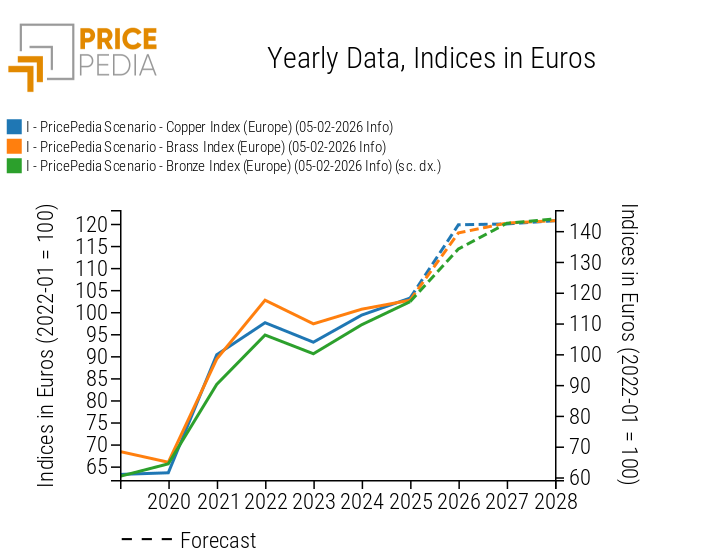
Copper
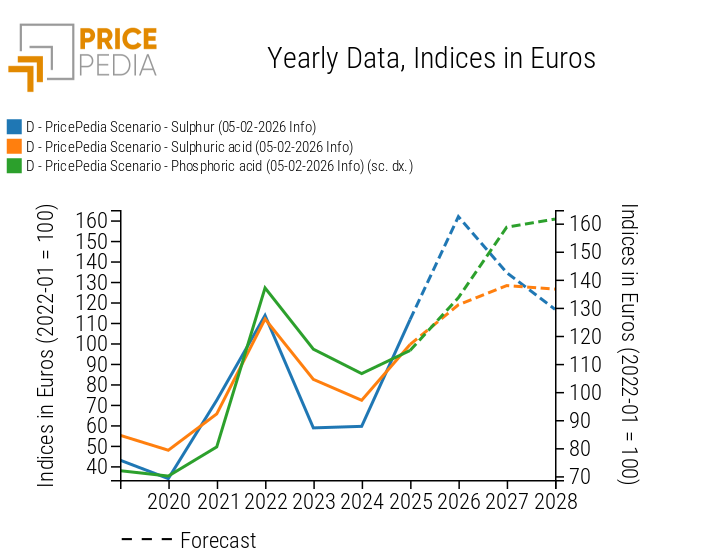
Sulphur
At the beginning of 2026, financial markets appear to have already priced in the tensions expected in the coming years, pushing the price of copper above the USD 13000 per tonne threshold. In this context, a moderate price adjustment is expected in the near term, with copper prices likely to stabilise within a range between USD 12500 and USD 13000 per tonne. However, these price levels for "red gold" have not yet been fully passed through to the prices of copper semi-finished products, brass and bronze alloys, and related manufactured goods. This price transmission process is expected to characterise at least the first part of 2026.
Similarly, in the sulphuric acid industry, a phase of marked price growth is under way which, so far, has mainly affected sulphur and sulphuric acid[4], but which is plausibly set to extend in the coming months to derived chemical products and the entire phosphoric acid value chain.
1. The global industrial cycle index is constructed by purifying the actual dynamics of industrial production from its trend. Since the supply of commodities tends to vary according to long-term economic growth expectations, while the demand for commodities is more linked to actual cyclical uses, the global industrial cycle index tends to reproduce the conditions of tension between demand and supply on the commodity market: when it increases, it means that the demand for commodities increases more than the supply; vice versa when it decreases.
2. The PricePedia Industrials index results from the aggregation of the indices relating to the following product categories: Ferrous, Non-Ferrous, Wood and Paper, Chemicals: Specialty, Organic Chemicals, Inorganic Chemicals, Plastics and Elastomers and Textile Fibres.
3. The PricePedia Commodity index results from the aggregation of the indices relating to industrial, food and energy commodities.
4. For a more detailed analysis, see the article Sulphuric acid: product scarcity and cost increases drive current high prices
You may be interested in:
LME nickel price forecast
Published by Luca Sazzini. .
Nickel Forecast ForecastLME nickel prices: what levels can we expect for 2026-2027? [ Read all ]

Food commodities: moving toward price normalization?
Published by Pasquale Marzano. .
Food Forecast ForecastDiverging trends by product category in 2026-2027 [ Read all ]

PricePedia scenario for ferrous metals 2026-2027
Published by Luca Sazzini. .
Ferrous Metals Forecast ForecastAfter years of decline, ferrous metal prices are expected to recover over the next two years [ Read all ]