Hidden curves: new cases of analysis
The sharp drops in prices affected multiple commodities
Published by Luigi Bidoia. .
Fertilizers basic thermoplastics Wirerod Organic acids Hidden curves
This article is a continuation of the article Hidden curves: 2024 profitability also depends on their discovery, where the hidden curves of four types of goods were analysed: wide rolled stainless steel, coniferous wood, alkaline hydroxides and vegetable oils.
This article reports the analysis of four other typologies, enriching the case study of commodities affected by strong decreases in prices:
- basic thermoplastics;
- fertilizers;
- organic acids;
- wire rods.
Basic thermoplastics
Below are the price curves over the last four years for some of the main basic thermoplastics.

Within thermoplastics there are two different product categories: basic thermoplastics and technopolymers.
The first category groups together polymers such as polyethylene, polypropylene, polystyrene, PVC and PET.
They are plastics widely used for general consumer and industrial applications. They are characterized by high demand which leads manufacturing companies to exploit economies of scale and to use prices as the main competitive lever.
The second category groups together products such as polycarbonates, polyamides, polytetrafluoroethylene and phenolic resins.
These plastic materials offer very high performance in terms of thermal, chemical and mechanical resistance.
Their demand comes from specific sectors (aerospace, automotive, electronics and medical) and
is lower than that of basic thermoplastics. Their production does not benefit, therefore,
of the same level of economies of scale and companies tend to compete not on price but on product differentiation, in terms of both performance and quality. These characteristics of the market and competitive factors make the prices of technopolymers weakly elastic in negative phases of demand.
Otherwise, the market and competitive characteristics of basic thermoplastics make their price highly dependent on cost dynamics and elastic to reductions in demand. After the price peak reached in the spring of 2022, the reduction in the feedstock price and the lower demand brought the prices of basic thermoplastics to levels only slightly higher than the average ones of 2019, with reduction rates close to -50% compared to at the maximum price point.
Fertilizers
The following graph shows the price curves of four commodities representing fertilizers.

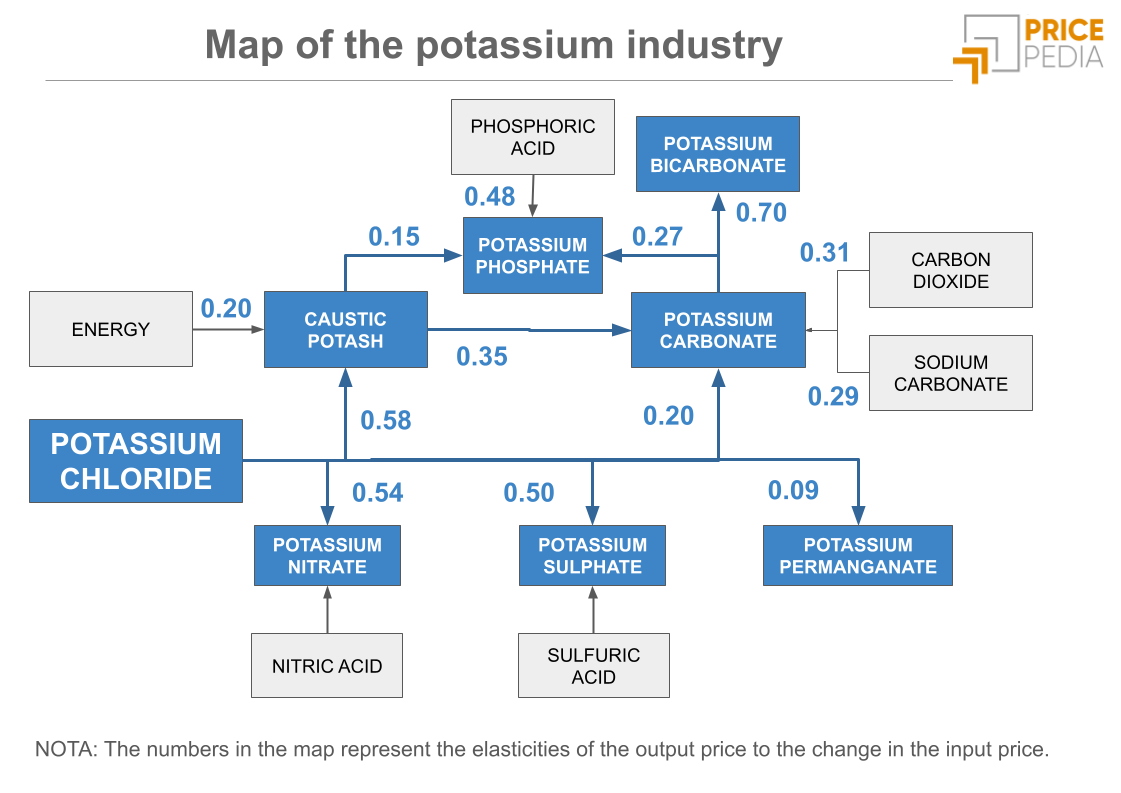
Over the last three years, the European fertilizer market has gone through a price cycle of exceptional intensity, linked to the strong cycle of natural gas prices and the blocking of Russian exports to the EU, in retaliation for the EU sanctions on Russia after the invasion of Ukraine.
In the article Fertilisers: the determinants of strong EU price growth, based on the analysis of the causes that had determined the very strong increase in prices during 2021 and the first months of 2022, a scenario was described forecast for 2023 characterized by:
- reduction in demand for chemical fertilizers with partial replacement of organic fertilizers;
- reduction in production costs, thanks to the expected reduction in gas prices in Europe;
- process of substituting Russian imports with those from other origins.
At the end of 2023 it is possible to verify that this scenario has been fully realized, leading to an average reduction in the price of fertilizers between the summer of 2022 and the summer of 2023 of over -50%. An important role in determining this reduction was given by the existence of a large international fertilizer market, capable of quickly replacing the smaller material coming from Russia. The main contribution was made by US exports, which increased over 6 months by a factor of 10, but also by Egyptian and Algerian exports and, no less important, by Trinidad and Tobago exports, which also increased by a factor of 10
Fertilizers are therefore a less well-known case, compared to for example natural gas, but no less
significant than...
the existence of a competitive international market can be a fundamental factor in reducing raw material risk.
Organic acids
Below are the price curves over the last four years of two organic acids: terephthalic acid (PTA) and adipic acid (AA).

Within organic acids, these two acids differ from the others due to their crucial role in the global economy,
due to their wide application in synthetic materials.
Terephthalic acid is crucial in the production of polyester, especially for fibers and PET bottles. Adipic acid is a key component in the production of nylon-6,6, used in various industries such as textile, automotive and packaging.
Both acids are produced in large volumes. In 2022, global PTA production was approximately 60 million tons, while global AA production was approximately 40 million tons. Furthermore, they are both derivatives of oil, the price of which determines the fluctuations in their costs.
Finally, their market is affected by global competition. The main producers of PTA and AA are located in Asia, particularly in China and India. Competition is intense and manufacturers must invest in innovation and efficiency to remain competitive.
Given these characteristics, their price curve of the last three years is not surprising, with strong growth corresponding to the growth phase of the oil price and the global industrial cycle and a phase of significant reduction in the face of the reduction in oil prices and, above all, of the phase of reduction in the levels of global industrial activity.
Wire rods
The following graph shows the price curves of four types of wire rods in recent years, different in carbon content of the steel and shape of the finished product. Beyond these differences, the price of the four products has followed dynamics in recent years almost identical which justify an aggregate analysis of a single price.

Wire rods are another case study of how important the existence of a competitive international market can be to reduce raw material risk. Wire rod was one of the first steel products to be included, already in March 2022, in the EU sanctions on imports from Russia. In a short time these were eliminated, reducing the supply on the EU market and contributing, with the increase in steel feed prices, to bring the price of wire rod to the record level of 1250 euros per tonne in May 2022.
In the following months, supply on the EU market increased significantly, with new flows of wire rod imports from Indonesia and, above all, Malaysia, more than offsetting the 2021 flows of Russian origin. The steel industry of the two Asian countries is still small,
but made up of many small dynamic companies that mainly produce long steel with an electric furnace. Attracted by high prices on the EU market, some of these companies quickly diverted part of their production to the EU market.
The balance between supply and demand allowed, in the second part of 2022 and the first part of 2023, the decrease in the price of electricity and steel scrap to translate into a decrease in the price of wire rod of over 40%.


