Mild temperatures in Europe and the effect on gas prices
An overview of current trends in the commodity landscape
Published by Giulio Corazza. .
Energy Ferrous Metals Food Non Ferrous Metals Commodities Financial WeekIn the first week of 2023, financial markets bet on a quick recovery in the EU and the Eurozone, comforted by the December reduction in inflation in Germany, following that in Spain, and a gas price that returned below 80 euros/KWh not only in spot quotes, but also in futures with maturities after the end of winter 2023-2024.
Natural gas prices at TTF for maturities of 1 to 18 months

The scenario that financial markets seem to be projecting for Europe and, more generally, for the world economy is characterized by a mild recession in the coming months, to be followed by a recovery as early as the end of 2023. Financial markets seem, therefore, to have already discounted the coming recession in order to project themselves as of now into the subsequent recovery. Within this scenario, the underlying trend of a recovery in financial commodity prices persists, with significant exceptions, however.
ENERGY PRODUCTS
The following chart shows the PricePedia financial indexes of Europe and U.S. energy product prices expressed in dollars. In the first week of the year, the energy indices are falling. More pronounced is the fall in prices for European products.
In Europe, mild temperatures during the period pushed down the price of natural gas. In addition, oil prices also showed a downward dynamic.
PricePedia financial indexes of energy prices Europe and the U.S.

The heatmap below provides an overview of energy product price trends. Particularly pronounced is the fall in natural gas and coal prices, both with double-digit negative weekly changes. Thanks to the record highs achieved in electricity production from wind and solar power, demand in Europe for gas and coal for power generation electricity is falling, contributing to the reduction in their prices.
HeatMap of energy prices

METALS
The following graph shows the PricePedia financial indexes of ferrous and nonferrous metal prices expressed in dollars. While the ferrous index shows an increase, the nonferrous index shows a sharp decrease.
Financial PricePedia indexes of ferrous and nonferrous metals

FERROUS METALS
The heatmap below provides an overview of ferrous metal price trends. The increase is generalized to all products. The change in hot coil prices is particularly pronounced.
HeatMap of ferrous metal prices

NON FERROUS METALS
The heatmap below provides an overview of the price trend of nonferrous metals. Particularly pronounced is the decline in nickel prices. However, this reduction seems to reflect the LME's increasing difficulties in the price-discovery process, rather than a deterioration in the fundamentals of the world nickel market. Adding to the structural problems facing the LME's nickel contracts this week were limited trading volumes and low liquidity.
Conversely, the upward race in the price of molybdenum continues.
HeatMap of non-ferrous metal prices

FOOD PRODUCTS
The following graph shows the PricePedia financial indices of food prices expressed in dollars. In the first week of this year, both the index from crops and the tropical index are down, due, for the former, to the reduction in grain prices and, for the latter, the price of arabica coffee.
Financial Indices PricePedia of groceries

You may be interested in:

Flexible packaging tailored to technical requirements: the PET/ALU/PE coffee pouch case
Published by Pasquale Marzano. .
Food Should CostStarting from the PET/PE stand-up pouch, how preservation requirements reshape the Should Cost structure [ Read all ]
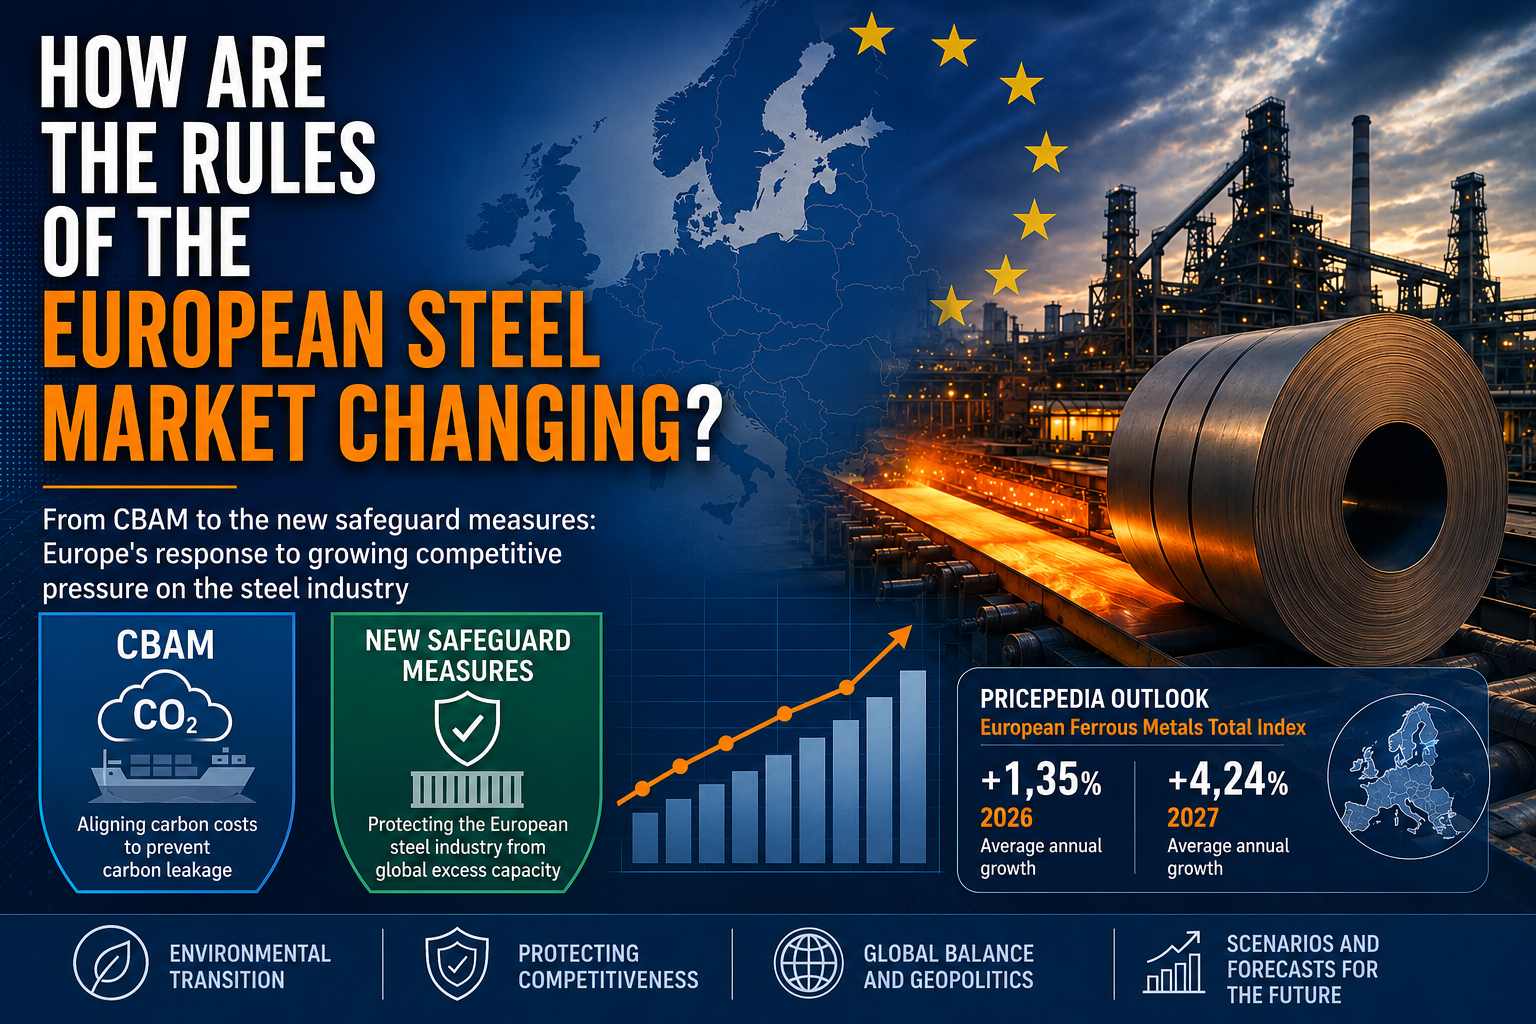
How are the rules governing the European steel market changing?
Published by Luca Sazzini. .
Ferrous Metals Forecast Energy Transition Import tariffsFrom the CBAM to new safeguard measures: the European response to growing competitive pressure on the steel industry [ Read all ]
Forecasting CO2 allowance prices in the European ETS market
Published by Martina Gallus. .
Energy Analysis tools and methodologiesUn approccio econometrico a due stadi [ Read all ]