Si mantiene elevata l'incertezza sui mercati finanziari delle matterie prime
Un overview delle tendenze in atto nel panorama delle commodity
Published by Giulio Corazza. .
Energy Ferrous Metals Range Food Non Ferrous Metals Commodities Financial Week
If there is one point where most commodity market analysts currently agree it concerns the high degree of uncertainty present in markets today, both financial and real.
This uncertainty originates from many sources. Foremost among these is the uncertainty hanging over the global business cycle, which has entered a recessionary phase that could end soon if monetary policies succeed in harnessing inflation and China improves its health policies, but could lengthen through 2023 if inflation does not decline quickly, if China perseveres with its lockdowns, if the war in Ukraine fuels new geopolitical tensions, and if the economic confrontation between the U.S. and China escalates.
Two other sources of uncertainty relate specifically to financial markets: the high volatility of financial prices and their opposite direction.
Volatility of commodity prices
The year 2022 is being characterized by high volatility[1] in the prices of commodity
in the financial markets. As the following graph shows, volatility began to increase before the beginning of 2022;
it increased sharply following the outbreak of war in Ukraine; it remained high throughout the year.
After the peaks in March and April 2022, volatility has remained essentially stable over the past seven months, at a level that is almost double the average volatility of the five-year period prior to the 2020 pandemic. This means that at this stage commodity prices tend to average weekly changes in absolute value that are almost double those of the pre-pandemic period.
Price volatility index PricePedia

Divergent dynamics
Another factor of uncertainty is the divergent dynamics that prices are often experiencing. This means that individual markets are increasingly influenced by specific (or idiosyncratic) factors that tend to dominate cross-cutting (or systemic) ones among different markets. An example of the frequent divergent price dynamics is the dynamics recorded in the last month by the euro price of oil (Brent) and the price of nickel: the former dropped by -24 percent; the latter increased by 21 percent.
Divergence between oil price and nickel price

ENERGY PRODUCTS
On the energy products front, OPEC+ members met last week to decide on production policy for next year. This remained unchanged from the earlier decision of a gradual reduction in oil production.
The following graph shows the PricePedia financial indexes of U.S. and European energy product prices. The former shows a sharp decrease, which is more moderate in the case of the Europe index, due to increases in natural gas in the European market.
PricePedia financial indexes of energy prices in Europe and the U.S.

The heatmap below provides an overview of energy product price trends.
Price reductions are widespread and significant, but do not, however, affect European natural gas prices.
HeatMap of energy prices

METALS
Prices of some metals in recent days have seen increases. Two factors may have helped support prices. On the one hand, the Chinese government has made arrangements with banks to support the real estate sector, and on the other hand, anti Covid measures have been further eased.
The following graph shows the PricePedia financial indexes of ferrous and nonferrous metal prices. This week the ferrous index is stable, while the nonferrous index is increasing.
PricesPedia Financial Indexes of ferrous and nonferrous metals

FERROUS METALS
The heatmap below provides an overview of ferrous metal price trends. It shows the sharp increase in iron ore prices in China, partially offset by the decrease in coil prices.
The sharpest increase, however, is in the price of molybdenum, which we have included in the Ferrous family
because of its prevalent use in steelmaking.
HeatMap of ferrous metal prices

NON FERROUS METALS
The heatmap below provides an overview of the price trend of nonferrous metals. The increase in prices appears to be generalized. Particularly notable, as reported, is the increase in the price of nickel, both listed on the London Metal Exchange (LME) and the Shanghai Futures Exchange (SHFE).
HeatMap of non-ferrous metal prices

FOOD PRODUCTS
The following graph shows the PricePedia financial indexes of food prices.
The phase of price reduction is continuing, especially for crop and livestock foods.
Conversely, the tropical food index has been relatively stable for the past few weeks.
PricePedia Financial indices of food products

FOODS FROM CROP
The heatmap below provides an overview of the trends in crop food prices. Sharp reductions in the prices of oats and soybean oil are noted. At the opposite end of the spectrum, soybean meal prices were up sharply this week.
HeatMap of crop food prices

[1] To calculate the volatility of financial commodity prices, 115 financial quotes from the PricePedia information system were considered. For each price, the weekly absolute rate of change was measured and an index given by the simple, day-by-day average of the 115 rates of change was constructed. Finally, the 30-term moving average of the daily index was calculated to capture persistence effects.
You may be interested in:
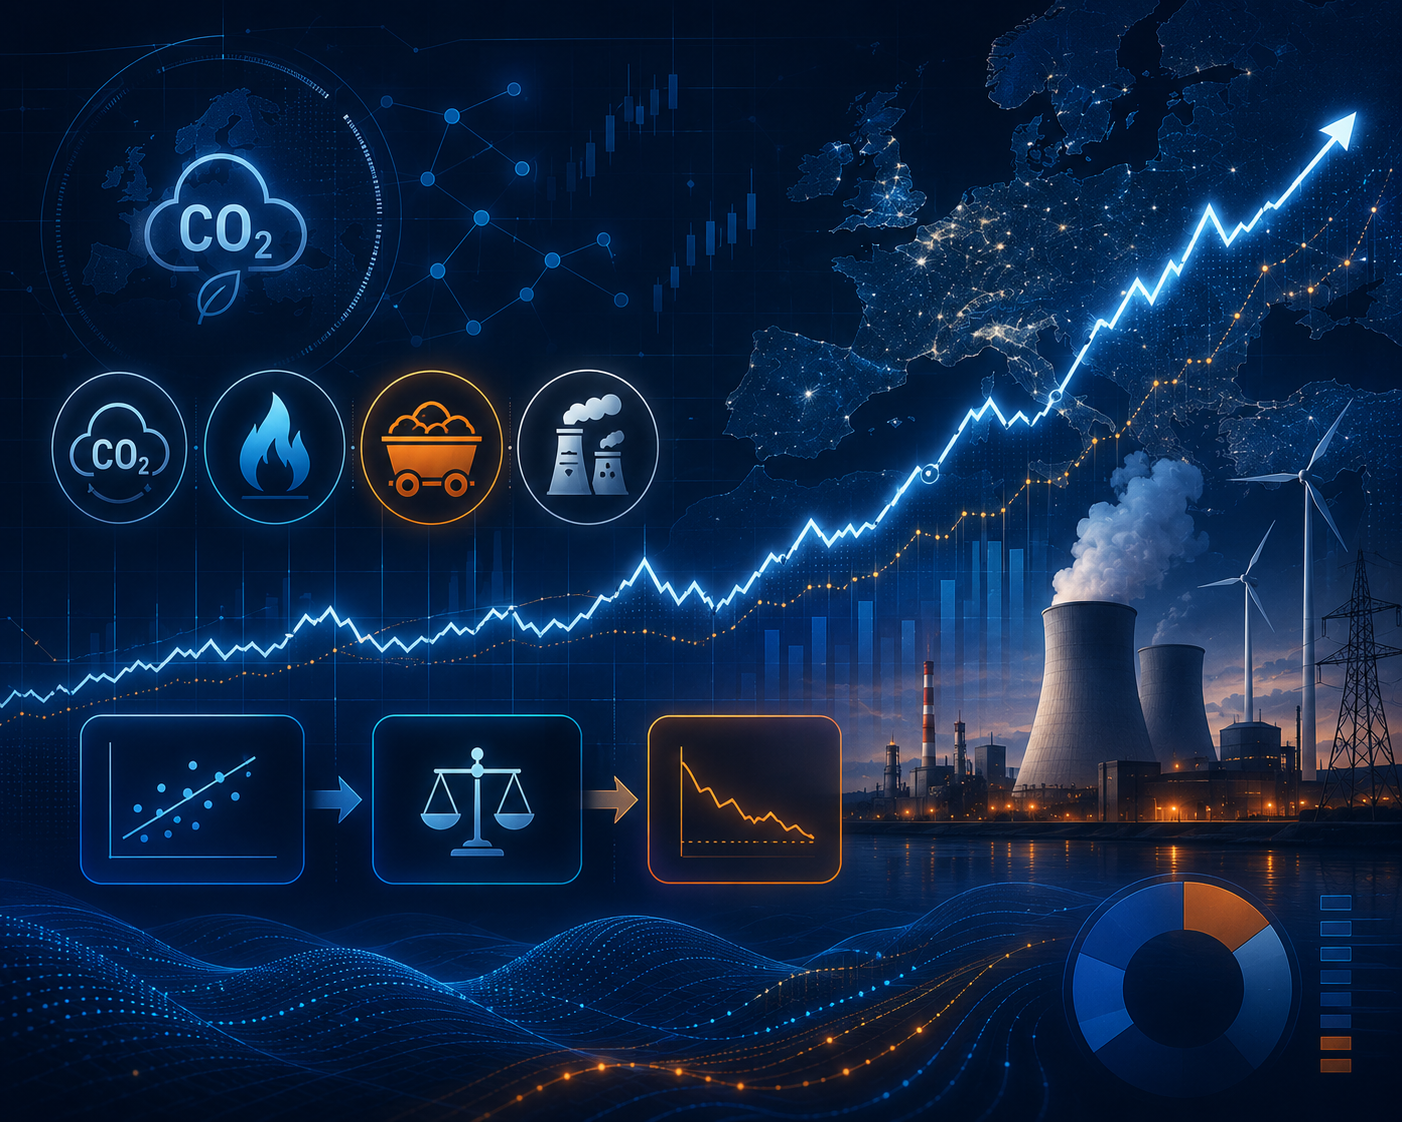
Forecasting CO2 allowance prices in the European ETS market
Published by Martina Gallus. .
Energy Analysis tools and methodologiesUn approccio econometrico a due stadi [ Read all ]

Hormuz Strait crisis and food packaging: from price dynamics to cost structure
Published by Pasquale Marzano. .
Food Packaging Paper Basic thermoplastics Should CostAn example of integrating non-material costs into the Should Cost for two stand-up pouch configurations [ Read all ]

Hormuz Crisis and Food Packaging
Published by Pasquale Marzano. .
Food Packaging Paper Basic thermoplastics Should CostHow material composition drives different cost impacts [ Read all ]