Commodity prices: from the conflict in Ukraine to today
An overview of current trends in the commodity landscape
Published by Giulio Corazza. .
Energy Ferrous Metals Food Non Ferrous Metals Commodities Financial Week
Russia is a major exporter of natural raw materials.
The risk of possible supply-side shocks to natural commodities led to sharp price increases in the aftermath of Russia's invasion of Ukraine. In the months following the start of the conflict, prices in some commodities fell back, returning to prewar levels, while others remained close to historic highs.
Significant decreases in commodity prices can be expected over the next few months due to the global economic slowdown.
Conversely, prices of some products, such as natural gas, may experience new upward phases caused by supply-side restrictions.
ENERGY PRODUCTS
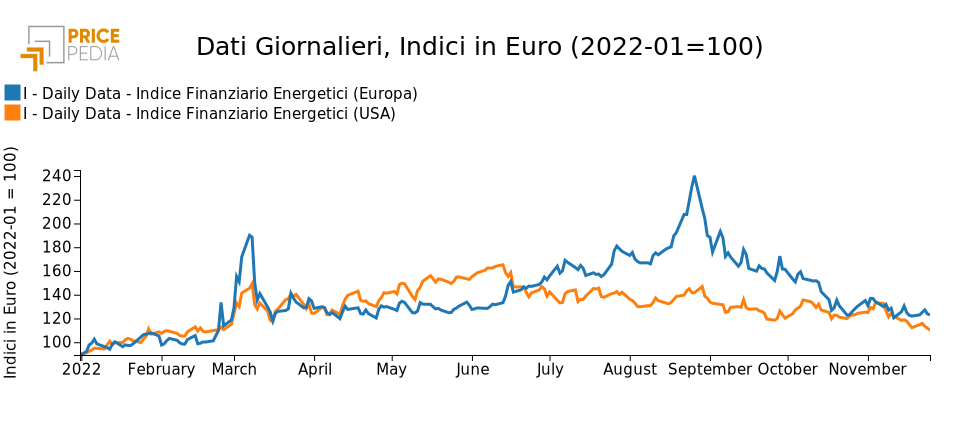
The following graph shows the PricePedia financial indexes of energy product prices.
The effects of the Russia-Ukraine conflict initially hit energy product prices hard, especially in Europe. In the United States, increases were more moderate.
We are currently in a phase of price descent. This descent appears to be slower for prices in the U.S. while it is faster in Europe.
The current week was marked by a significant decrease in the U.S. index, due to the decrease in oil prices. The Europe index was more stable: the decrease in oil prices was offset by the increase in gas prices.
PricePedia financial indexes of energy prices in Europe and the U.S.
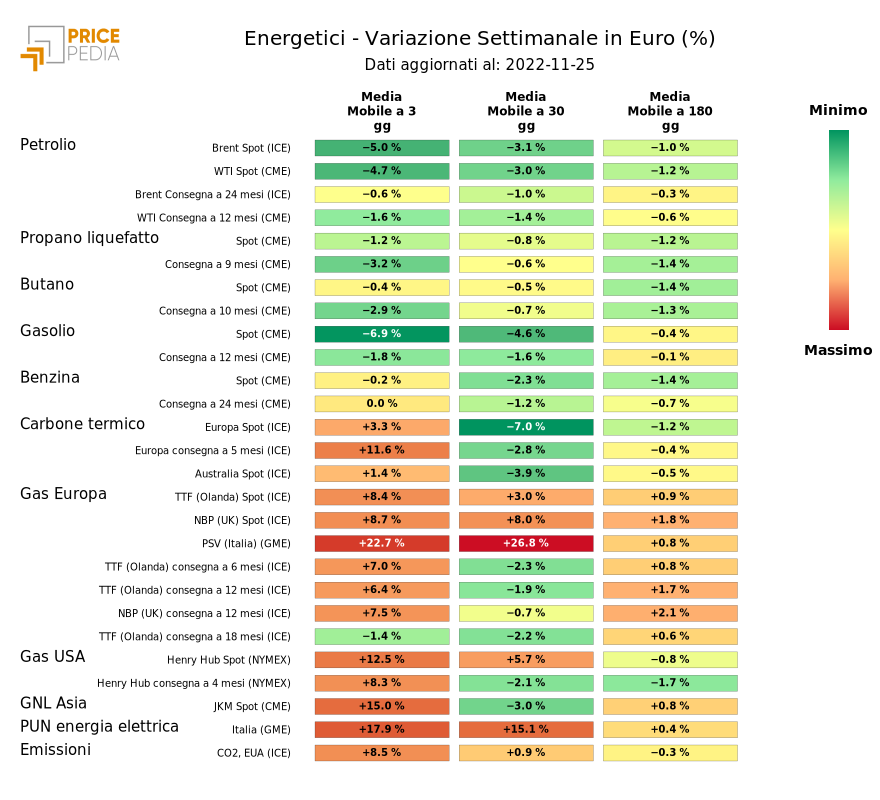
The heatmap below provides an overview of energy product price trends.
As mentioned above, the significant decrease in the price of oil and the sharp increase in the price of natural gas are noted.
HeatMap of energy prices
METALS
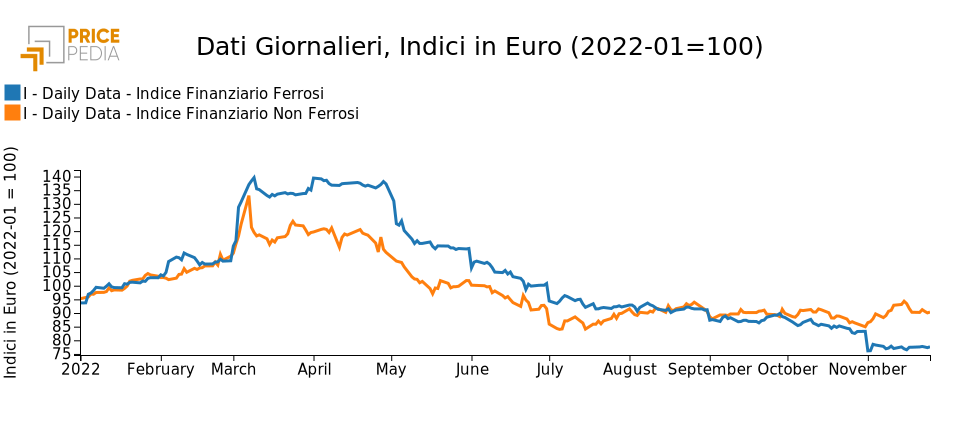
The following graph shows the PricePedia financial indexes of ferrous and nonferrous metal prices.
The war in Ukraine with rising energy costs and the possible reduction in supply of many metals by the
two conflicting countries, initially led to higher prices, especially for ferrous metals. Over the summer, when it became clear that the effects of the global economic slowdown would more than offset possible supply reductions, both price families headed down a negative path, steeper for ferrous, less steep for nonferrous. Along this medium-term trend, the last week has seen substantial stability for ferrous and a slight downward trend for nonferrous.
PricePedia financial indices of ferrous and nonferrous metals
FERROUS METALS
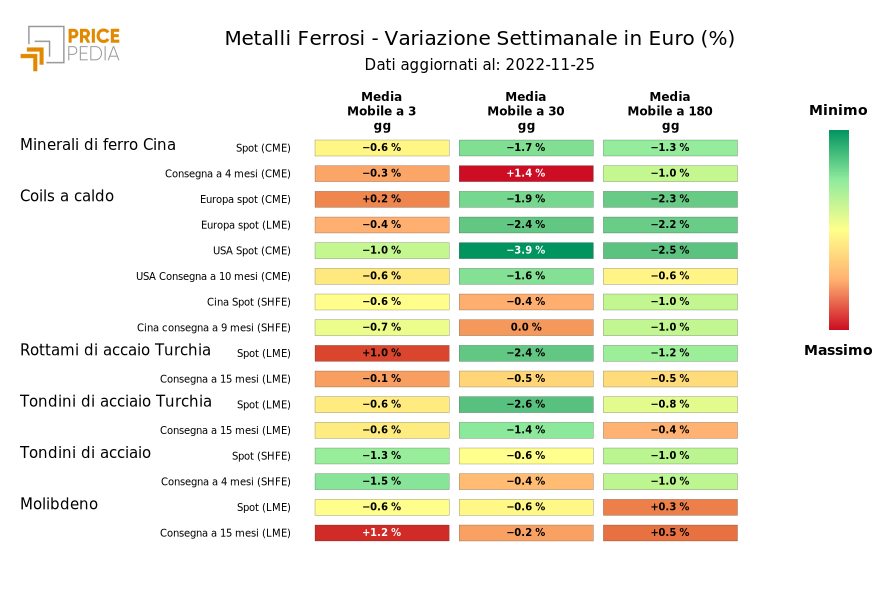
The heatmap below provides an overview of ferrous metal price trends.
In general, the ferrous complex is stable. The most significant declines we can see in the change in the 30- and 180-day moving averages of hot coils in Europe and the U.S., indicating a clear downward trend.
HeatMap of ferrous metal prices
NONFERROUS METALS
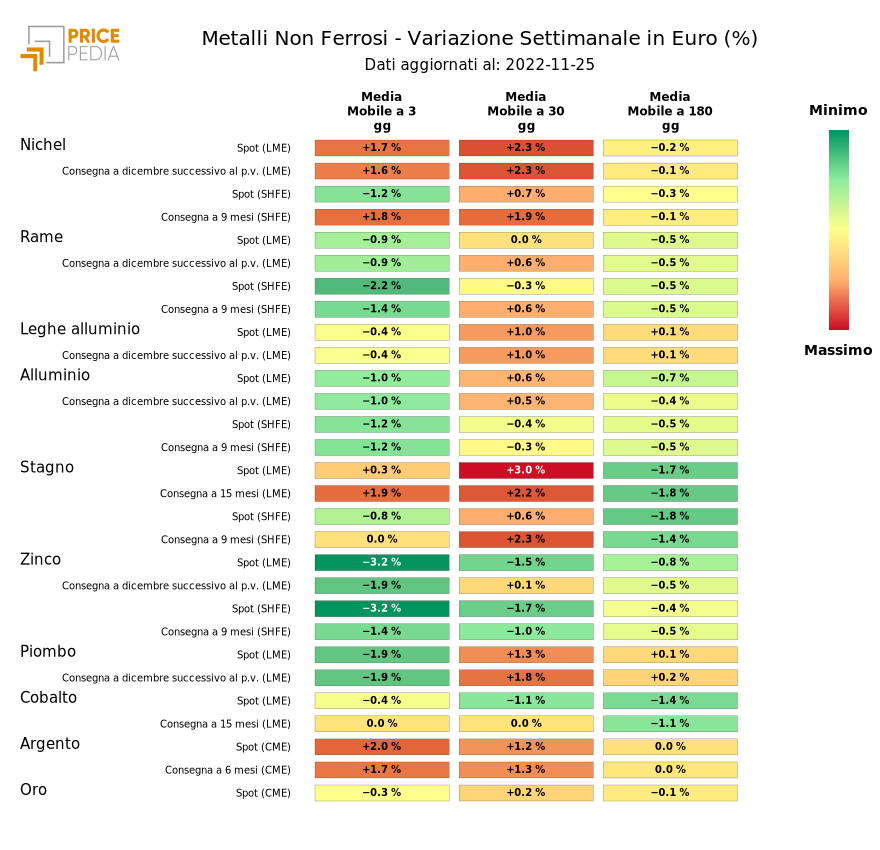
The heatmap below provides an overview of non-ferrous metal price trends.
Zinc prices are reported to have fallen sharply this week.
HeatMap dei prezzi dei metalli non ferrosi
FOOD PRODUCTS
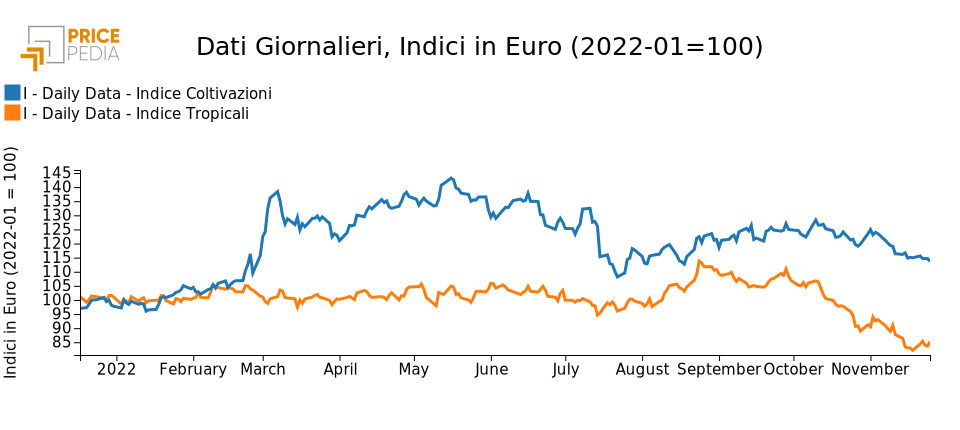
The following graph shows the PricePedia financial indexes of crop and tropical food prices.
On the food commodities front, the Russia-Ukraine conflict affected crop prices the most, supporting their level. The Pricepedia index for this financial price family closed the week at 114, up 14 percent from average January 2022 levels.
However, food prices are also discounting the ongoing slowdown in the world economy. The tropicals index accuses a downward trend already since the end of August. The downward trend for crop foods is more recent, beginning 4 weeks ago.
PricePedia Financial Indices of food products
FOODS FROM CROPS
The heatmap below provides an overview of the trend in crop food prices. The sharp decrease in the price of canola oil is noted.
HeatMap of crop food prices
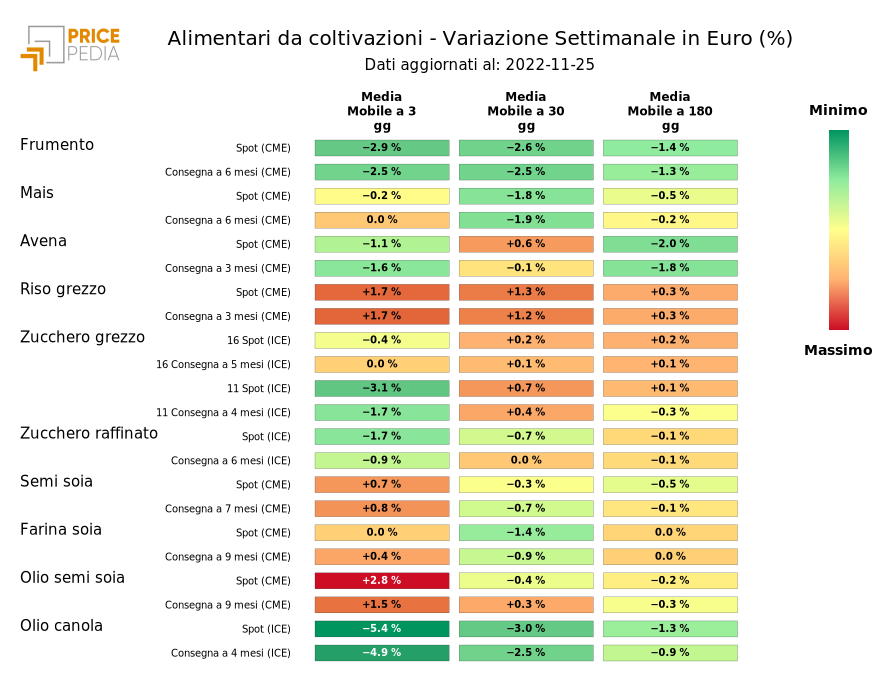
Australian canola supply, thanks to a record harvest, is gaining world market share by replacing Canadian canola, from which canola oil is derived. In addition, falling oil prices and new closures in China are reducing demand for rapeseed and canola, which are mainly used in biodiesel production. In this situation, the spot price of canola oil quoted on the Intercontinental Exchange (ICE) declined from $926/mt in early November to $813 on Friday, maintaining a backwardation structure for future maturities.
Canola oil: prices at the ICE exchange


