How renewable energy is changing hourly electricity prices in Italy
Published by Emanuele Morelli. .
Energy Electric Power Analysis tools and methodologiesIn June, the hourly structure of the Italian electricity price (PUN) changed radically, as clearly shown in the graph below.

This change fits into a longer-term trend. In recent years, the price of electricity in Italy has become increasingly volatile. Days with prices close to zero, unprecedented hourly fluctuations, and a growing influence of renewable sources. In this article, we try to explain what is happening to the Single National Price (PUN) of electricity using data, models, and interpretations.
Economic analysis clearly shows that the PUN in Italy is largely determined by the price of natural gas and the price of CO₂ certificates [1].
In recent years, the hourly PUN has, on average, been slightly higher than the sum of the cost of natural gas (assuming an overall efficiency of 50%), the cost of CO₂ emissions (assuming emissions of 300 kg per MWh produced), and other fixed costs (set at 10 euros per MWh produced). At various times, however, the price has fallen well below the cost of gas and CO₂, indicating that in those hours the price was not determined by the marginal costs of thermoelectric plants.

As shown in the graph above, a significant phenomenon in recent years has been the increased volatility of the PUN, not only day-to-day but especially within the same day.
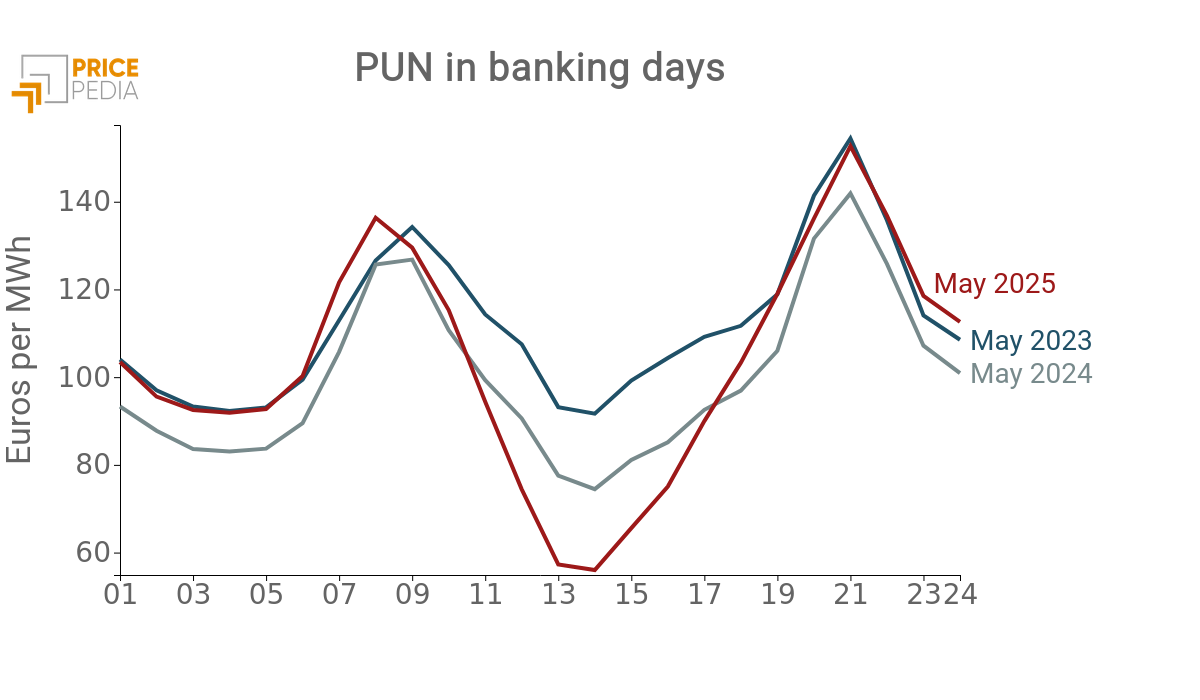
The following graphs highlight the increasing dispersion of hourly prices. The analysis shows the average hourly PUN trend for the month of May over the past 3 years, distinguishing between banking and non-banking days (Saturdays, Sundays, and italian public holidays).
Hourly PUN profile - May 2023–2025
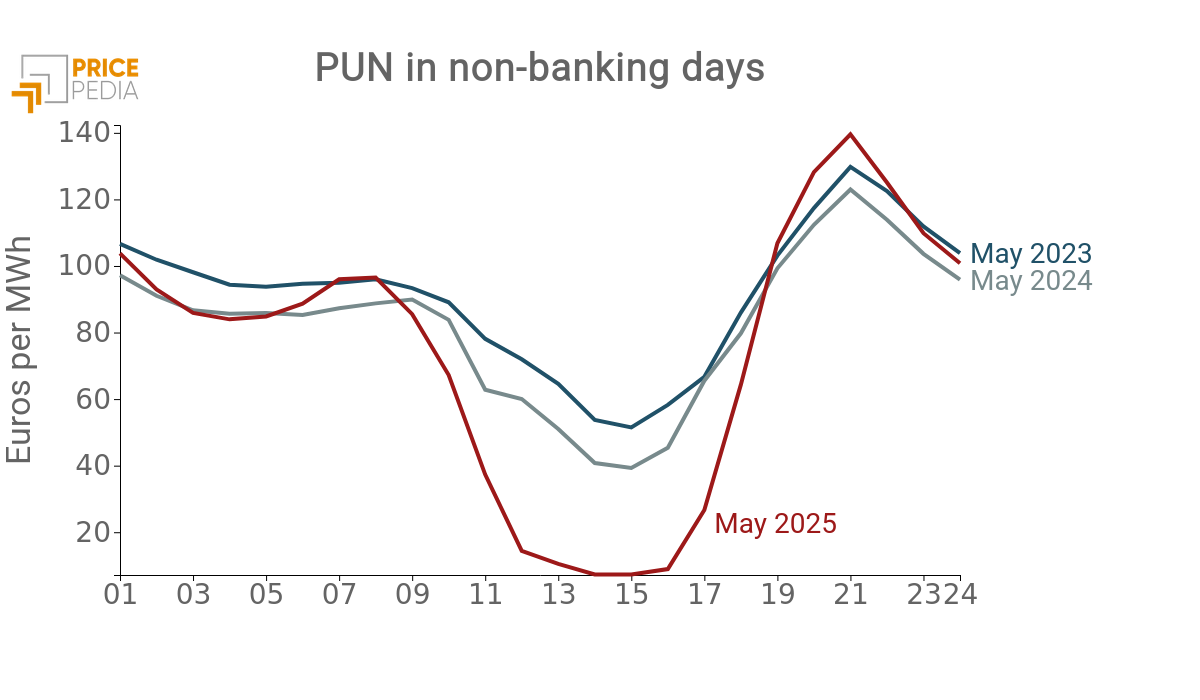
As clearly shown, price dispersion is greater on non-banking days, especially in 2025. The reason lies in the fact that lower demand during weekends and holidays makes it more likely that renewable energy supply alone can meet demand. In such cases, the price is no longer set by the cost of gas-based thermoelectric plants, but by the unit cost—close to zero—of renewable energy (RES). In this regard, in May 2025 there were as many as 3 holidays (01/05, 18/05, and 25/05) during which the PUN dropped to 0 €/MWh at various hours.
| Date | Hour | PUN |
|---|---|---|
| 2025-05-01 | 14 | 0.01 |
| 2025-05-01 | 15 | 0.0 |
| 2025-05-01 | 16 | 0.01 |
| 2025-05-18 | 14 | 0.0 |
| 2025-05-18 | 15 | 0.0 |
| 2025-05-18 | 16 | 0.0 |
| 2025-05-25 | 11 | 0.01854 |
| 2025-05-25 | 12 | 0.0 |
| 2025-05-25 | 13 | 0.0 |
| 2025-05-25 | 14 | 0.0 |
| 2025-05-25 | 15 | 0.0 |
| 2025-05-25 | 16 | 0.0 |
| 2025-05-25 | 17 | 0.0 |
Want to stay updated on commodity market trends?
Subscribe for free to the PricePedia newsletter!
ROLE OF RENEWABLE ENERGY SOURCES
To highlight the effect of renewable energy sources (RES), we removed the influence of gas prices, CO₂ certificate prices, and the weekend effect from the hourly PUN. This way, by analyzing the "cleaned PUN", we can focus on the other factors contributing to its formation.
The following scatterplot shows the relationship in 2025 between the share of renewable energy and the cleaned PUN across different days and hours.

This cloud of points allows us to identify three distinct clusters:
- Cluster 1: cases where renewables account for less than 50% of total energy production and have no significant effect on the PUN;
- Cluster 2: cases where renewables exceed 70% of national energy production and cause a collapse in the PUN;
- Cluster 3: the most interesting cases, where the PUN is significantly lower than expected, even though the renewable share in that hour is below 70%.
We further investigated the last two clusters. The table below shows the number of observations, the average national RES share, the average cleaned PUN, and the dispersion of RES shares across the different zones of the Italian electricity grid.
| Indicator | Cluster 2 | Cluster 3 |
|---|---|---|
| Number of observations | 320 | 314 |
| Average RES share (%) | 80.4 | 60.6 |
| Average cleaned PUN | -58.6 | -40 |
| RES share dispersion by area | 59.8 | 93.9 |
The distinct feature of the third cluster is the high dispersion of renewable energy results across different Italian zones, especially compared to the second cluster. While the national share of renewables in this cluster does not exceed 70%, in some areas, at specific hours, renewables reached nearly 100%, excluding gas thermoelectric supply and driving electricity prices down.
Conclusions
Empirical evidence shows that the Italian PUN is also influenced by the share of energy produced from renewables. This share affects prices not only when it is high across the whole country but also when it is high in one or more of the zonal areas of the Italian power system. From a statistical perspective, this means that PUN forecasting models can be improved by considering not only the national renewable energy share but also the dispersion across zones. It is sufficient for one zone to have a high share of renewable electricity to affect the national PUN.
[1] For a detailed analysis of the PUN determination model, see the article Determinants of the PUN .
You may be interested in:

The impact of renewable sources on the Italian PUN: a detailed analysis
Published by Emanuele Altobel. .
Electric Power Price DriversIn the Italian energy market, the effect of renewables becomes significant when they exceed 40% of total production [ Read all ]
Hourly and Daily Effects on the PUN Price
Published by Riccardo Pondini. .
Electric Power Price DriversThe Variations in Hourly and Daily Electricity Demand as a Significant Component of the PUN Price [ Read all ]
The impact of renewable sources on Italian electricity reference price
Published by Leonardo Morieri. .
Electric Power Price DriversItaly's renewable energy growth begins to reduce PUN [ Read all ]