Should Cost and Breakdown Analysis: an applied example on 6061 Aluminum Alloy
An analytical case developed using PricePedia data and features
Published by Luca Surace. .
Strumenti Should Cost Should CostThe article "Building a reliable should cost: the importance of breakdown analysis" highlighted how the construction of a reliable should cost necessarily involves an accurate breakdown analysis of the cost of a good. This methodology allows for estimating the cost of a product and serves as a strategic tool for the purchasing department, both in the budgeting phase and during negotiations.
This article presents a practical example of building a should cost for 6061 Aluminum Alloy using the new functionality available in PricePedia. To simplify the construction of the index, we will consider only the cost of raw materials, excluding "non-physical" cost components such as labor or energy. However, this simplification is only for narrative clarity: the PricePedia Should Cost tool does in fact allow for the inclusion of inputs such as labor, electricity, and other non-physical components.
6061 Aluminum Alloy
6061 Aluminum Alloy is one of the most widespread and versatile within the aluminum-magnesium-silicon alloy family (6xxx series). Appreciated for its excellent balance between mechanical properties, corrosion resistance, and workability, it is used in a wide range of industrial applications thanks to its good weldability and heat treatability.
Among the main application sectors:
- Automotive, for the production of lightweight structural components such as frames, brackets, wheels, and suspension parts;
- Aerospace, where it is used for secondary parts and auxiliary structures;
- Construction, particularly for windows, doors, structural elements, and cladding;
- Industrial mechanics, for tools, machinery, extruded profiles, and bases;
- Cycling and sports, where it is used for bicycle frames and equipment requiring high performance and low weight.
From a chemical standpoint, 6061 Aluminum Alloy is mainly composed of pure aluminum, combined with other elements that enhance its mechanical performance and workability. The table below shows the typical composition of this alloy.
| Element | Symbol | Percentage (%) |
|---|---|---|
| Aluminum | Al | 95.8 – 98.6 |
| Magnesium | Mg | 0.8 – 1.2 |
| Silicon | Si | 0.4 – 0.8 |
| Iron | Fe | ≤ 0.7 |
| Copper | Cu | 0.15 – 0.4 |
| Chromium | Cr | 0.04 – 0.35 |
| Zinc | Zn | ≤ 0.25 |
| Manganese | Mn | ≤ 0.15 |
| Titanium | Ti | ≤ 0.15 |
Definition of the Reference Unit and Technical Cost Coefficients
As highlighted in the article cited above, the first step in building a should cost through breakdown analysis is the definition of the reference unit, i.e., the unit against which the quantities of each input (the technical cost coefficients) will be defined.
The reference unit can be defined as:
- a unit of the finished product (e.g., a single machine, a component, a specific product);
- a weight-based quantity of the good under consideration, typically 1 ton.
In the case of 6061 Aluminum Alloy, since it is a raw material in semi-finished form sold by weight, we chose to adopt one ton of alloy as the reference unit.
To define the technical cost coefficients for the input materials, we refer to its chemical composition, indicating for each input the amount in kg required to produce one ton of alloy. Additionally:
- since technical specifications indicate percentage ranges for each element (e.g., magnesium 0.8–1.2%), it is necessary to choose a representative value within the range;
- given the negligible cost impact of iron, it will be excluded from the analysis.
The following table shows, for each input material, the PricePedia EU customs price series used in the should cost calculation and the related cost coefficient expressed in kg of input required per ton of 6061 Aluminum Alloy.
| Material | PricePedia EU Customs Price Series | Weight (kg) per ton of 6061 Aluminum Alloy |
|---|---|---|
| Aluminum | Unalloyed unwrought aluminium | 974.0 |
| Magnesium | Unwrought magnesium (weight ≥ 99.8%) | 10.0 |
| Silicon | Silicon | 6.0 |
| Copper | Copper cathodes | 3.0 |
| Chromium | Powders of unwrought chromium | 2.0 |
| Zinc | Unwrought zinc (weight ≥ 99,99%) | 2.5 |
| Titanium | Unwrought Titanium | 1.5 |
| Manganese | Unwrought manganese | 1.0 |
From Technical Coefficients to Cost Share
Once the technical cost coefficients for each input material have been defined, it is possible to move on to the next phase of the breakdown analysis: the economic valuation of each input and the subsequent calculation of the cost share of each input relative to the total cost.
To carry out this operation, the technical coefficient (expressed in kg per ton of alloy) must be multiplied by the material price in a reference period. In PricePedia, the base period used is January 2022.
Based on the defined technical coefficients and the prices of each material in the base period, the PricePedia Should Cost tool automatically calculates the cost share of the individual materials, while still allowing the user to adjust them to meet specific needs.
The following table shows, for each material:
- its price in €/Ton in the reference period;
- the total material cost in € in the reference period;
- its incidence on the total cost.
| Material | PricePedia EU Customs Price Series | Technical Coefficient (Kg) |
Price in 2022-01 (€/Ton) |
Material Cost in 2022-01 (€) |
Cost Incidence in 2022-01 (%) |
|---|---|---|---|---|---|
| Aluminum | UUnalloyed unwrought aluminium | 974.0 | 2846 | 2771.8 | 96.07 |
| Magnesium | Unwrought magnesium (weight ≥ 99.8%) | 10.0 | 2877 | 28.8 | 1.00 |
| Silicon | Silicon | 6.0 | 2339 | 14.0 | 0.49 |
| Copper | Copper cathodes | 3.0 | 8700 | 26.1 | 0.90 |
| Chromium | Powders of unwrought chromium | 2.0 | 8817 | 17.6 | 0.61 |
| Zinc | Unwrought zinc (weight ≥ 99,99%) | 2.5 | 3160 | 7.9 | 0.27 |
| Titanium | Unwrought Titanium | 1.5 | 10526 | 15.8 | 0.55 |
| Manganese | Unwrought manganese | 1.0 | 3276 | 3.3 | 0.11 |
| Total | 2886 | 100.00 | |||
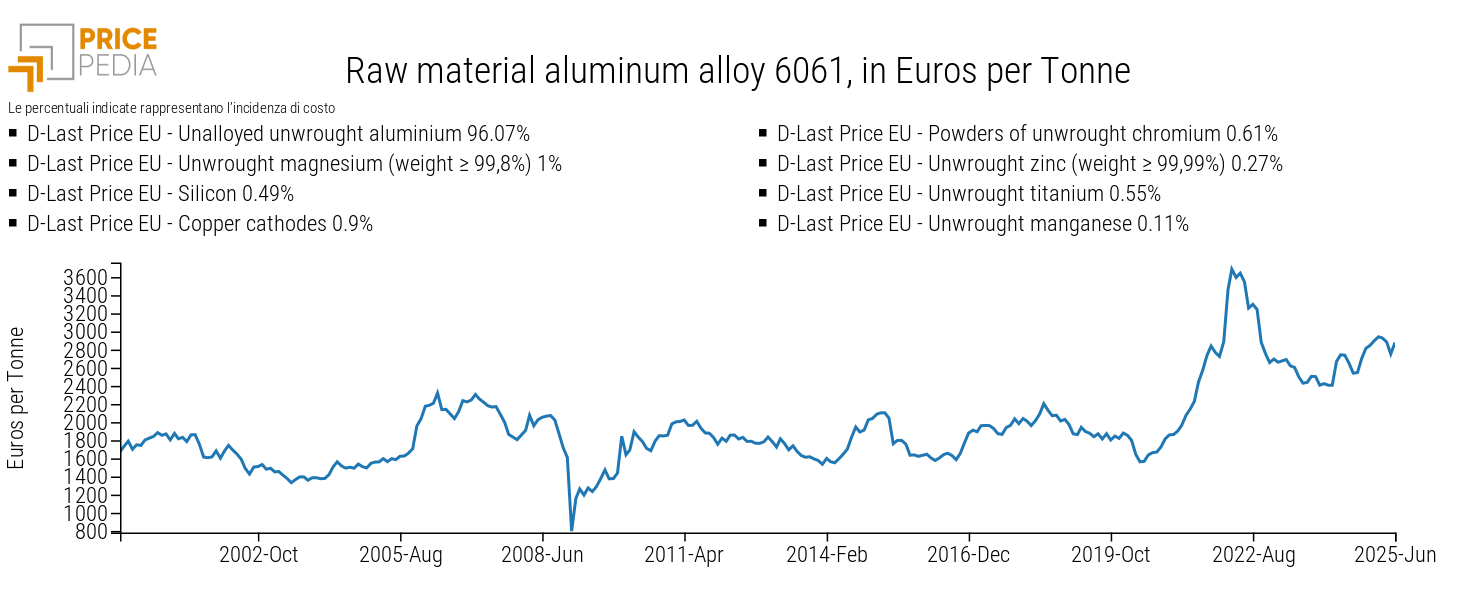
As expected given the chemical composition of the alloy, nearly the entire cost is attributable to the raw aluminum component, which accounts for about 96%, while the remaining 4% is distributed among the other alloying elements.
The Raw Material Cost of 6061 Aluminum Alloy
Starting from the cost of €2886/Ton calculated for the reference period (January 2022), it is possible to reconstruct the historical evolution of the raw material cost of 6061 Aluminum Alloy over the time period of interest.
The following chart shows the trend in the cost of the alloy from 2000 to the present, obtained using the new Should Cost tool from PricePedia and based on the methodological steps illustrated in the previous paragraphs.
Conclusions
The example of 6061 Aluminum Alloy clearly shows how the new Should Cost feature in PricePedia is a valuable ally for procurement professionals already familiar with complex cost analyses. Thanks to an intuitive interface and a solid methodological structure, it is possible to build a detailed analytical model in just a few clicks—starting from the technical composition of the good and arriving at the cost incidence of individual materials.
In a context of great uncertainty like the current one, having a tool capable of quickly turning complex data into actionable insights is a decisive competitive advantage. With PricePedia, breakdown analysis and should cost construction become not only more accessible, but also more impactful.
You may be interested in:

The should cost of Panettone
Published by Pasquale Marzano. .
Food Should Cost Should CostDo raw material cost dynamics justify recent panettone price inflation? [ Read all ]

The arrival of foundation models in time series forecasting
Published by Riccardo Gentilucci. .
Strumenti Machine learning and EconometricsNew Machine Learning Forecasting Systems [ Read all ]
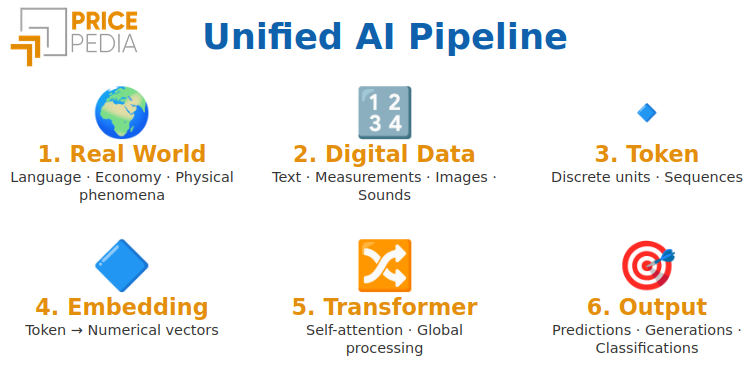
Tokens & Transformers: the heart of modern Machine Learning models
Published by Luigi Bidoia. .
Strumenti Machine learning and EconometricsCome una tecnologia unificata ha accelerato l’evoluzione dell’AI [ Read all ]