Commodity prices waiting for U.S.-China talks
Tensions over TTF: EU toward permanent halt to Russian supplies
Published by Luca Sazzini. .
Conjunctural Indicators Commodities Financial WeekWeekly Summary of Financial Commodity Prices
Hopes for a possible de-escalation of trade tensions between the United States and China interrupted last week's decline in commodity prices, leading to some increases in the early days of the current week. One example is the oil market: after a drop of over 8% the previous week,[1] Brent prices partially recovered, driven by expectations of a possible reduction in trade barriers ahead of agreements between the US and China, and by a new decline in US oil inventories.
The prices of TTF Netherlands natural gas were the main focus this week, recording a 5.5% increase on Tuesday alone. This rise was triggered by the European Union’s announcement of its plan to completely eliminate its dependence on Russian gas by the end of 2027. To implement this plan, the EU proposed a two-phase strategy. The first phase includes a ban on signing new contracts with Russian gas suppliers, both by pipeline and LNG, and the suspension of spot contracts with immediate payment by the end of 2025. According to estimates, this measure should ensure that by the end of this year, the EU will have reduced the remaining Russian gas supplies by one third.
The second phase involves a total ban on all remaining Russian gas imports by 2027. The goal of the strategy is to reduce the risks associated with supply security and the stability of the energy market.
In the industrial metals market, the week was marked by relative price stability,
with greater weakness in ferrous metals.
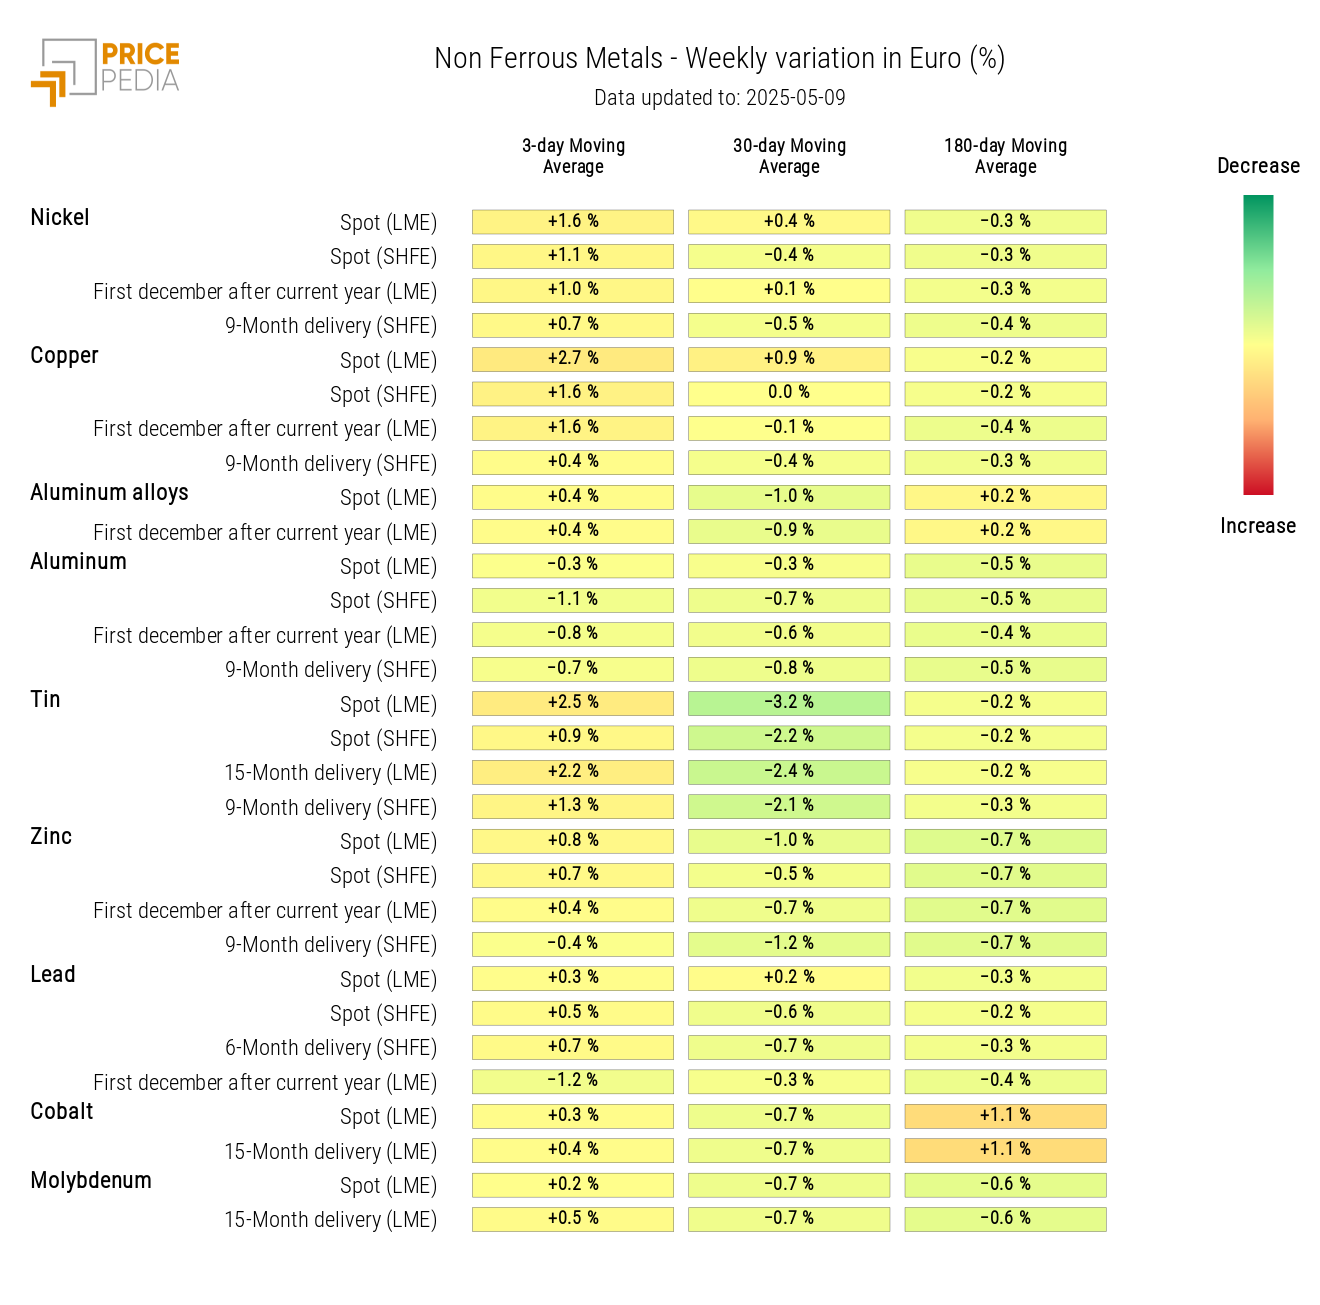
Non-ferrous metals experienced higher volatility, especially copper and tin prices, which, despite fluctuations, ended the week with overall gains. Their growth was mainly driven by expectations of easing US-China trade relations, in a context where both metals have historically shown high sensitivity to recent US trade policy decisions.
Federal Reserve Monetary Policy
At the meeting held on May 6-7, the Federal Reserve (FED) kept interest rates unchanged in the 4.25% - 4.50% range. The decision was unanimous and aligned with market and analyst expectations.
The US economy was described as solid, but rising trade tensions could lead to higher unemployment, inflation, and slower economic growth. As a result, the risks of possible stagflation in the US economy are increasing—a situation characterized by high inflation and economic stagnation.
This scenario increases uncertainty over the Federal Reserve's future monetary policy decisions, as it may have to choose between avoiding an economic contraction and containing inflation growth. For now, the FED appears inclined to maintain a cautious approach, waiting for the effects of the new trade tariffs before taking further action.
For an in-depth look at last week's oil price decline, see the article: Demand fears put pressure on commodity prices
NUMERICAL APPENDIX
ENERGY
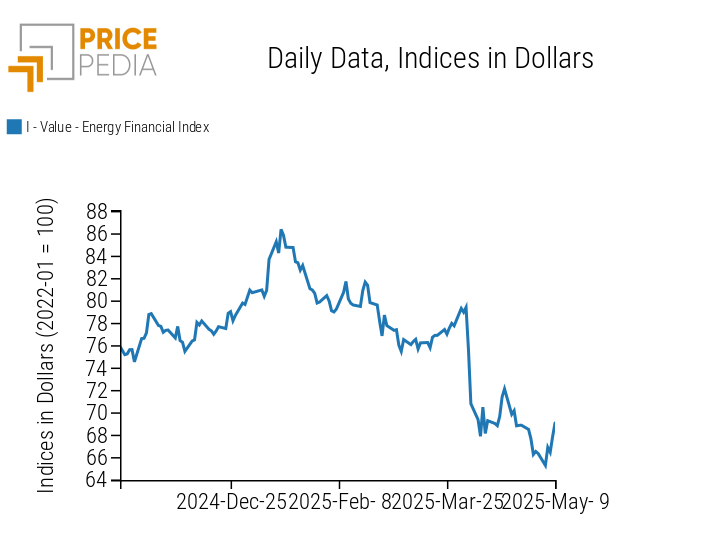
The PricePedia financial index of energy products recovered part of the drop recorded last week.
PricePedia Financial Index of Energy Prices in Dollars
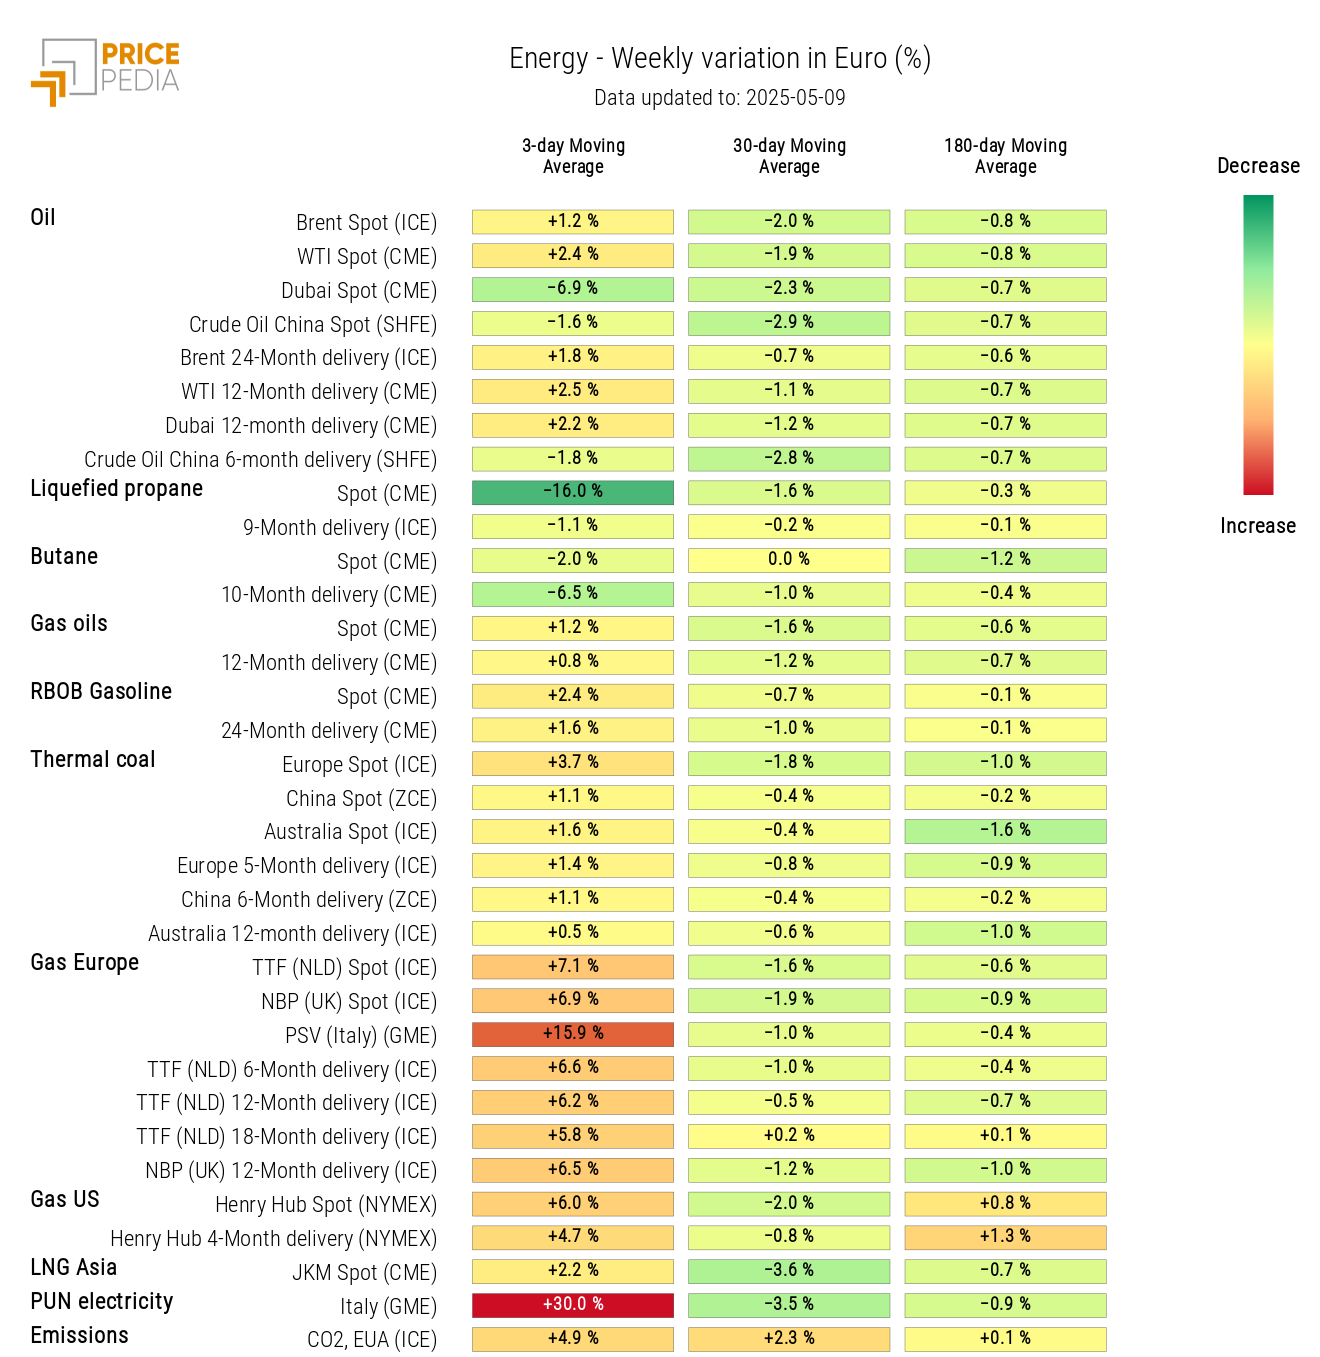
The energy heatmap shows a weekly increase in TTF Netherlands European natural gas prices.
On the Italian market, natural gas prices rose more than the European average, with a significant increase in the PSV price. This week, the spread between the price of gas at the Italian virtual trading point and the Dutch TTF was 3.5 euro/KWh, a historically high value indicating a malfunction in the Italian wholesale gas market. This higher gas cost in Italy also resulted in higher electricity prices, with the average weekly PUN rising above 100 euro/MWh. The gap with wholesale electricity prices in France and Spain was more than fivefold.
It is also worth noting a negative weekly change in the 3-day moving average for Dubai crude oil prices and, more notably, for US spot prices of liquefied propane.
HeatMap of Energy Prices in Euro
PLASTICS
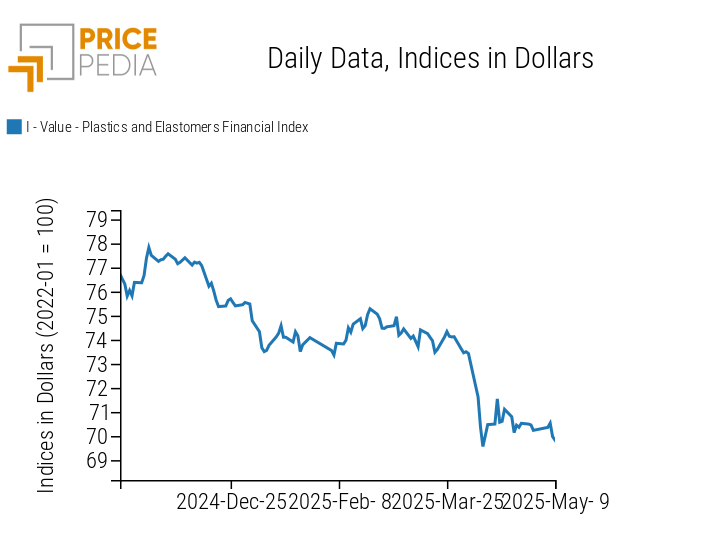
After an initial rise at the start of the week, the financial index of plastics and elastomers turned downward.
PricePedia Financial Indices of Plastics Prices in Dollars
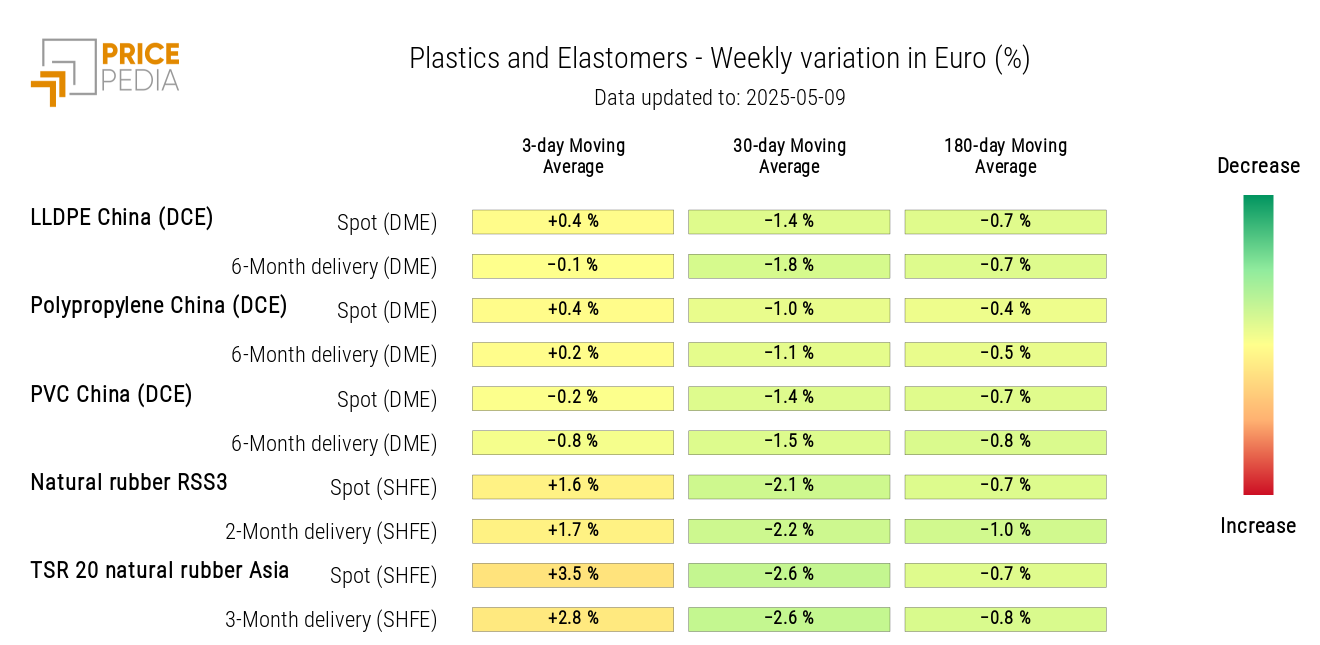
The plastics price heatmap shows rather limited changes in the 3-day moving average, with slight increases in natural rubber prices.
HeatMap of Plastics and Elastomers Prices in Euro
FERROUS METALS
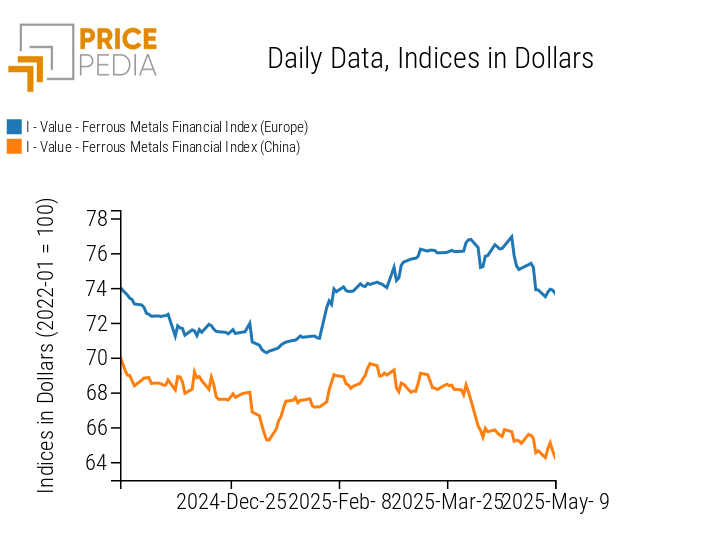
The two indices (European and Chinese) of ferrous metals continue their slight downward trend.
PricePedia Financial Indices of Ferrous Metal Prices in Dollars
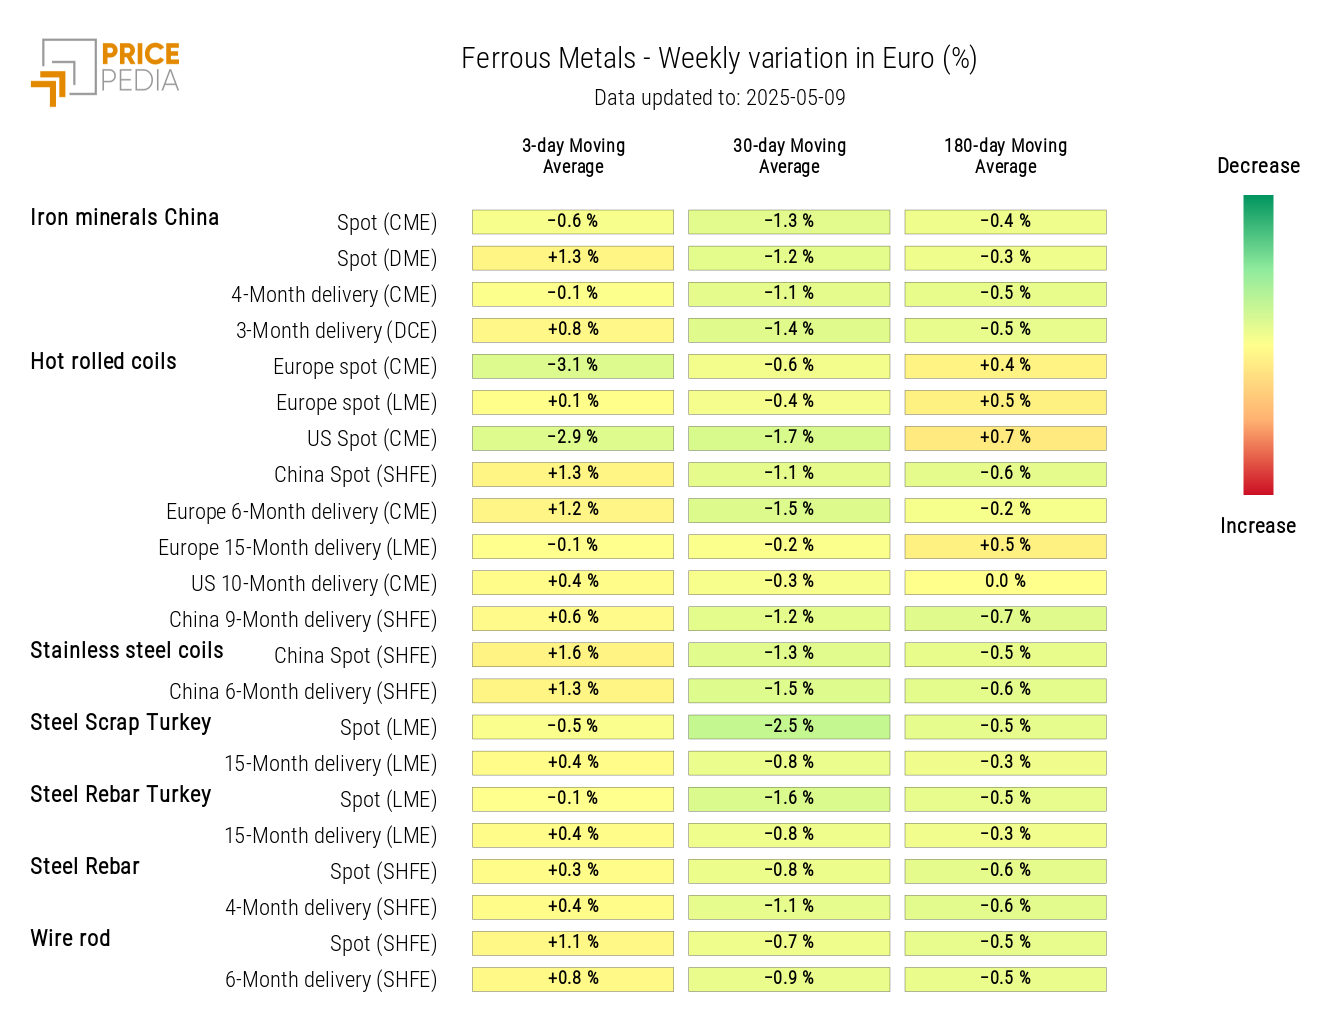
The ferrous metals heatmap shows a weekly decline in the 3-day moving average for coil prices in Europe and the US, alongside a slight increase in Chinese prices of iron ore and stainless steel coils.
HeatMap of Ferrous Prices in Euro
Do you want to stay up-to-date on commodity market trends?
Sign up for PricePedia newsletter: it's free!
NON-FERROUS INDUSTRIAL METALS
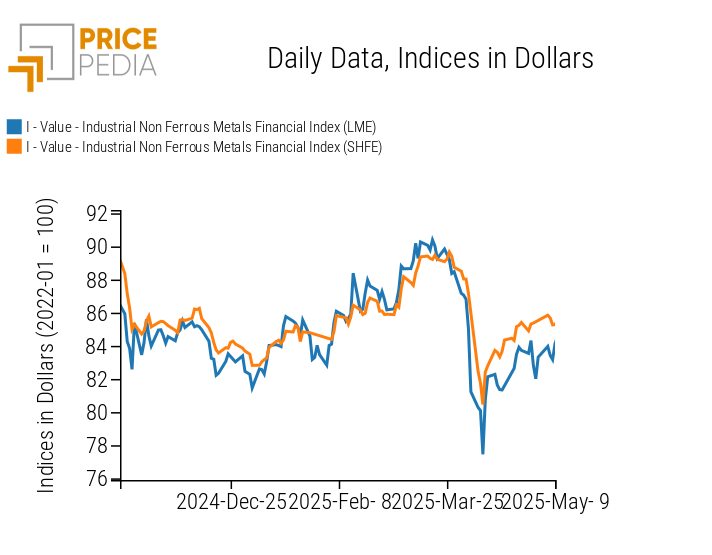
The LME and SHFE financial indices of non-ferrous metals showed greater volatility than that recorded in the ferrous metals market and a slight upward trend.
PricePedia Financial Indices of Non-Ferrous Industrial Metal Prices in Dollars
The non-ferrous heatmap highlights the weekly rise in LME tin and copper prices.
HeatMap of Non-Ferrous Prices in Euro
FOOD COMMODITIES
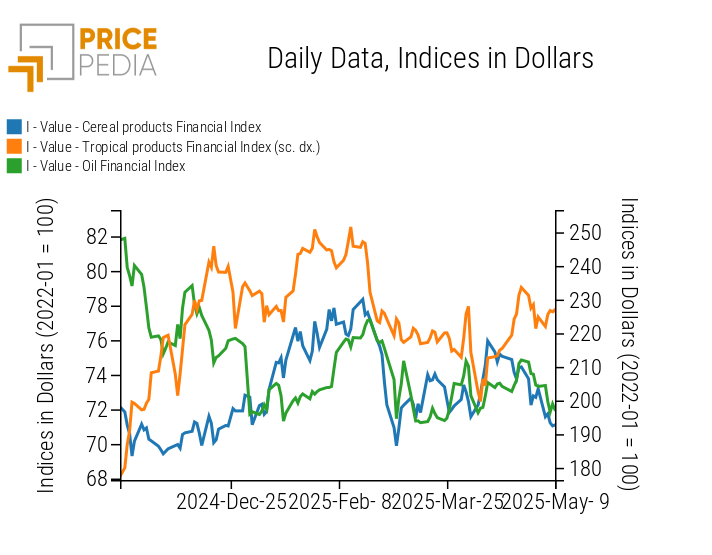
Financial indices of food products showed mixed trends throughout the week.
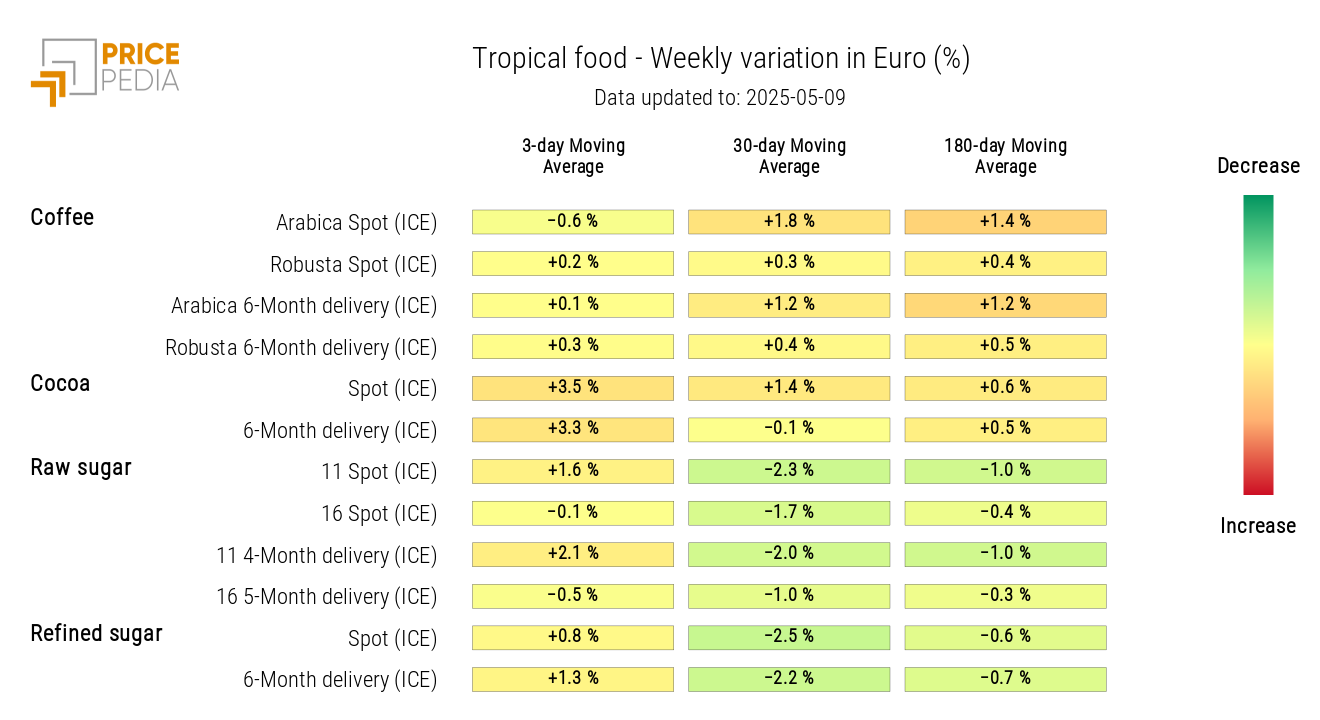
Net of fluctuations, cereal and oil indices ended lower, while the tropicals index saw a slight increase due to the partial rebound in cocoa prices on Tuesday and Wednesday.
PricePedia Financial Indices of Food Prices in US Dollars
CEREALS
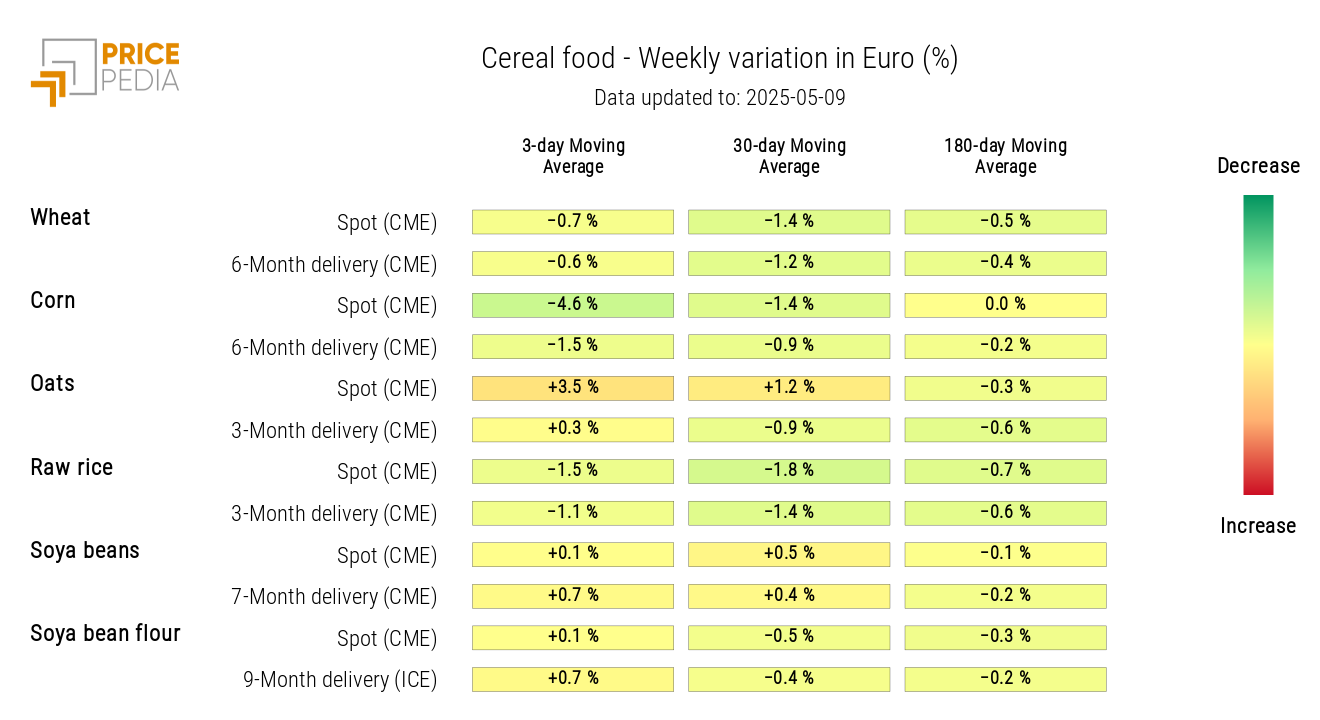
The analysis of the cereals heatmap shows a weekly decrease in corn prices and an increase in oat prices.
HeatMap of Cereal Prices in Euro
TROPICAL PRODUCTS
The heatmap of tropical products highlights a weekly increase in cocoa prices.
HeatMap of Tropical Food Prices in Euro
OILS
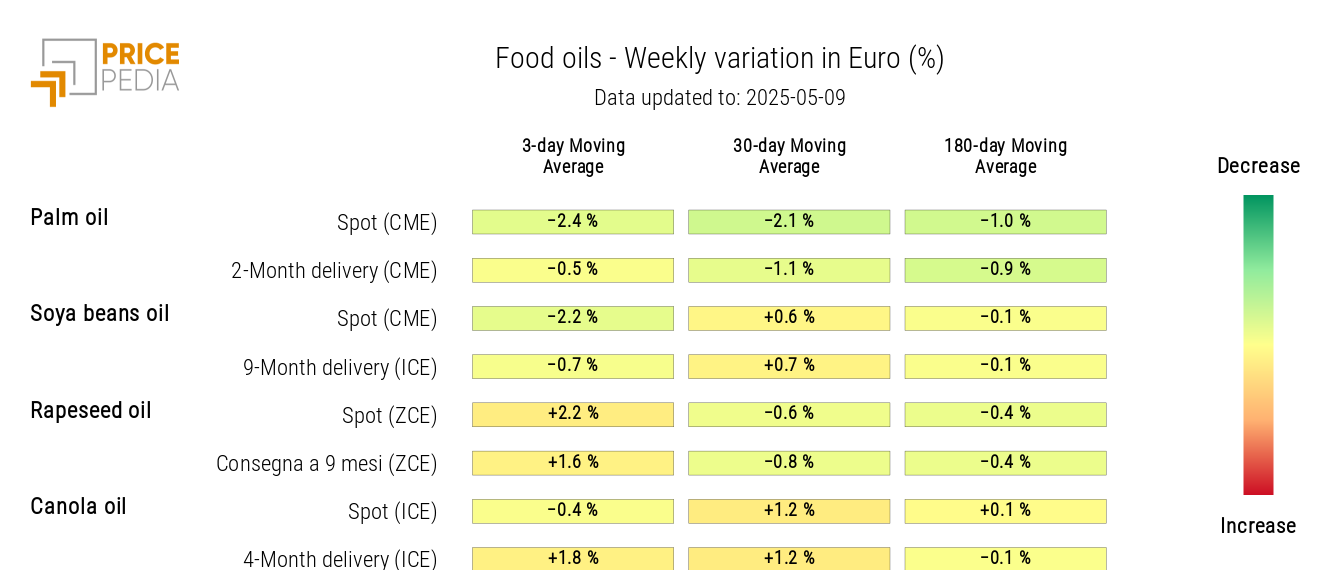
The heatmap of edible oils shows a drop in spot prices of soybean oil and palm oil, alongside an increase in rapeseed oil prices.
HeatMap of Edible Oil Prices in Euro
