Effects of the US-China trade war on commodity prices
Which sectors will be most impacted by the trade reallocation channel
Published by Pasquale Marzano. .
USA customs duties Import tariffs
Only one week after introducing "reciprocal" measures against trade partners, the US administration paused their actual enforcement for the following 90 days, opening the door to a potential negotiated resolution.
Despite this temporary backtrack (see the article From Liberation to Rollback Day: how markets forced a break on Trump), trade tensions remain far from resolved. The additional 10% tariff on all partner countries is still in effect, and more importantly, measures against China remain in force. China is the world's most important producer of raw materials and one of the key trading partners for the US. As of now, US tariffs on Chinese goods amount to 124%.
The following chart shows the latest developments in tariffs related to the US-China trade war (source: Peterson Institute for International Economics).
US-China Tariff Evolution

China's response to the US was equally strong: the Beijing government imposed a 147% tariff on products imported from the US.
Given China's role as the world’s leading producer of raw materials, this escalating trade conflict raises the question of which sectors will experience the strongest downward price pressures due to increased availability of Chinese products on international markets, through the trade reallocation channel explained in the article How tariffs reshape markets: the effect on commodity prices.
Do you want to stay up-to-date on commodity market trends?
Sign up for PricePedia newsletter: it's free!
A first answer can be found by observing, for each product, the share of Chinese exports absorbed by the US: all else being equal, the larger this share, the more likely it is that international prices will come under downward pressure due to an increased availability of the product in global markets outside the US.
Moreover, this effect will be more significant the greater the US’s share in global demand.
The following table lists products for which the share of Chinese exports to the US exceeds the average Chinese export share to the US, which is 13%. Alongside this indicator is a measure of the importance of the US in global demand, calculated as the share of US imports out of total global imports (based on data from ExportPlanning).
The table also indicates whether the product is included in Annex II, published on April 2, which lists products exempt from tariffs. For these products, it is likely that no price-depressing effect will occur through the trade reallocation channel, since they are currently expected to remain exempt from US tariffs in the near future.
| Product | Commodity Group | China's Export Share to the US | US Demand | Exemption as of April 2, 2025 |
|---|---|---|---|---|
| Benzene | Chemical Products | 46.00% | 15.00% | |
| Powders of unwrought chromium | Metal Products | 43.00% | 30.00% | X |
| Unwrought titanium | Metal Products | 33.00% | 41.00% | X |
| Tungstates | Chemical Products | 32.00% | 21.00% | X |
| Antimony Oxides | Chemical Products | 31.00% | 27.00% | X |
| Glycerol | Chemical Products | 26.00% | 9.00% | |
| Rolled Bronze Sheets | Metal Products | 26.00% | 16.00% | X |
| Natural Graphite | Chemical Products | 25.00% | 23.00% | X |
| Natural Barium Sulfate (Barite) | Chemical Products | 24.00% | 25.00% | X |
| Brass Tubes | Metal Products | 20.00% | 18.00% | X |
| Polymeric Methylene Diphenyl Diisocyanate (MDI) | Chemical Products | 19.00% | 8.00% | |
| Corrugated Cardboard Boxes and Cases | Other | 19.00% | 8.00% | |
| Optical Fibre Cables | Other | 18.00% | 26.00% | |
| Fluoroelastomers FKM | Chemical Products | 17.00% | 17.00% | |
| P-xylene | Chemical Products | 17.00% | 10.00% | |
| Silicon Carbides | Chemical Products | 17.00% | 19.00% | X |
| Diethylene Glycol | Chemical Products | 16.00% | 9.00% | |
| Fluorides of ammonium or of sodium | Chemical Products | 16.00% | 8.00% | |
| Needle Roller Bearings | Metal Products | 16.00% | 14.00% | |
| Monoethanolamine | Chemical Products | 15.00% | 10.00% | X |
| MDF Panels (thickness > 5mm and ≤ 9mm) | Other | 14.00% | 7.00% | X |
| Hypophosphites and Phosphites | Chemical Products | 13.00% | 10.00% | |
| Coniferous Plywood | Other | 13.00% | 28.00% | X |
| Benzoic Acid | Chemical Products | 13.00% | 12.00% | X |
| Copper Electric Cables (voltage > 1000V) | Metal Products | 13.00% | 19.00% | |
| Flexible Plastic Tubes | Other | 13.00% | 10.00% |
Most of the items listed in the table belong to the chemical and metal product families.
In particular, for the latter category, many products such as Powders of unwrought chromium and Unwrought titanium have been exempted from tariffs, given the high US share of global demand and China's critical role in American supply chains.
As for chemical products, the percentage of exemptions is lower, leading to an expectation of more pronounced price declines on international markets. In the case of Benzene, it is difficult to quantify the downward price effect, also due to the various production sources of benzene (see the article From raw materials to markets: how prices are formed in basic petrochemicals).
Finally, it is worth noting that in the case of Optical fibre cables and Fluoroelastomers FKM, the US market absorbs a significant share of Chinese exports, with the US accounting on average for 20% of global demand.
You may be interested in:
Analysis of the effects of trade barriers on wire rod prices
Published by Luca Sazzini. .
Wirerod EU customs duties USA customs duties Import tariffsWire rod: price gap between China, EU and US widens due to tariffs [ Read all ]
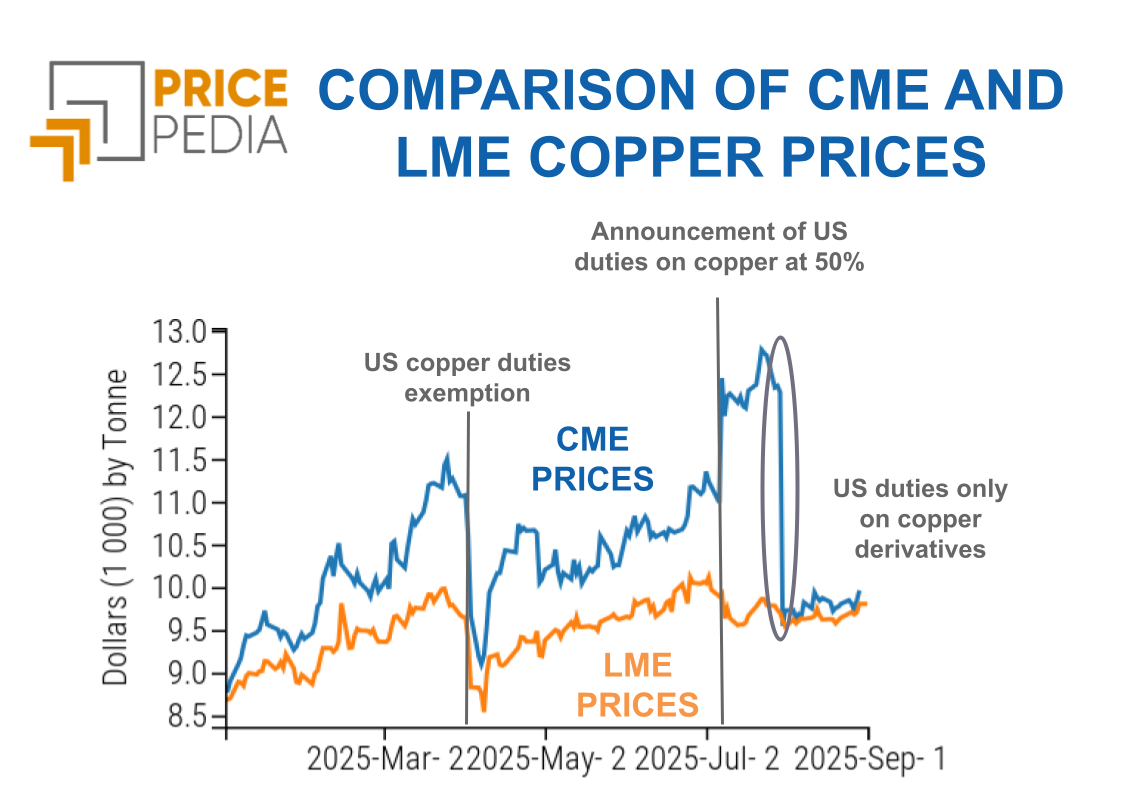
Trump's game on copper tariffs
Published by Luca Sazzini. .
Copper Non Ferrous Metals USA customs duties Import tariffsUS tariffs: why is copper different from steel and aluminium? [ Read all ]

Indirect effects of U.S. duties on zinc
Published by Luca Sazzini. .
Zinc Non Ferrous Metals USA customs duties Import tariffsU.S. duties and substitution effects between aluminum and zinc [ Read all ]