New turbulence in non-ferrous markets
Do recent increases in copper and aluminum prices reflect lower supply in Western markets or a stockpile in China?
Published by Luca Sazzini. .
Conjunctural Indicators Commodities Financial WeekGlobal Economic Outlook
The current macroeconomic scenario is characterized by growth in the US economy, stagnation in the eurozone, and a slow recovery in the Chinese economy. Economic data from the US and China this week have confirmed this conjunctural picture of growth.
USA
New data on US retail sales have exceeded analysts' expectations, showing a year-on-year growth of 4% in March. Industrial production has grown in line with expectations, signaling a monthly change of 0.4% in March.
These data confirming the resilience of the US economy, combined with inflation data, have pushed back expectations for the next interest rate cut by the FED. President Powell has stated that to combat inflationary pressures in the USA, he will not hesitate to keep interest rates unchanged for as long as necessary.
China
In the first quarter of 2024, Chinese GDP exceeded analysts' expectations, recording a growth of 5.3% y/y.
The industrial sector increased by 6.6% y/y in the first quarter of 2024, compared to 5.5% in the last quarter of 2023. Despite these encouraging figures, the recovery remains fragile due to weak domestic demand and the real estate sector crisis.
Dynamics in Commodity Markets
The escalation in the Middle East last week did not translate into an increase in oil prices.
Following Iran's attack on Israel, which occurred late on Saturday, April 13, oil prices did not increase but, on the contrary, saw some reductions. The oil market avoided immediate hikes, awaiting Israel's next move, which occurred on the night of Thursday, April 18. Following the Israeli attack, Brent's intraday prices on Friday morning initially rose, only to retreat in the following hours. The market's main concern is the possibility of a full-scale war between Israel and Iran, the fourth-largest producer within OPEC+.
This would lead to an increase in oil prices supported by several factors, including:
- increases in sanctions against Iran;
- possible Israeli attacks on Iranian energy infrastructure;
- disruption of oil flows through the Strait of Hormuz.
On the industrial metals front, there have been upward movements in both ferrous and non-ferrous prices.
In recent months, ferrous prices have been influenced by the decline in steel production in China, which fell by 7.8% year-on-year last month. The current real estate crisis has led to a sharp drop in steel demand, resulting in reduced supply from China.
The most recent signals of price recovery seem to indicate a new balance in the Chinese steel market.
Non-ferrous metals have seen price increases driven by decisions from the London Metal Exchange (LME) and the Chicago Mercantile Exchange (CME) to ban the delivery of Russian metals produced after April 12.
Ban on delivery of Russian metals in Western financial exchanges
The London Metal Exchange and the Chicago Mercantile Exchange have decided to introduce delivery bans on metals produced in Russia. The metals subject to these bans are copper, aluminium, and nickel. These 3 metals can no longer be delivered to LME and CME warehouses unless they were produced by April 13, 2024. The aim of these sanctions is to reduce Russia's revenue from non-ferrous metal exports. However, this ban will lead to a short-term increase in the prices of these metals on their respective financial exchanges. This increase is particularly evident in the London Metal Exchange market, which is the main global reference point for non-ferrous metal prices.
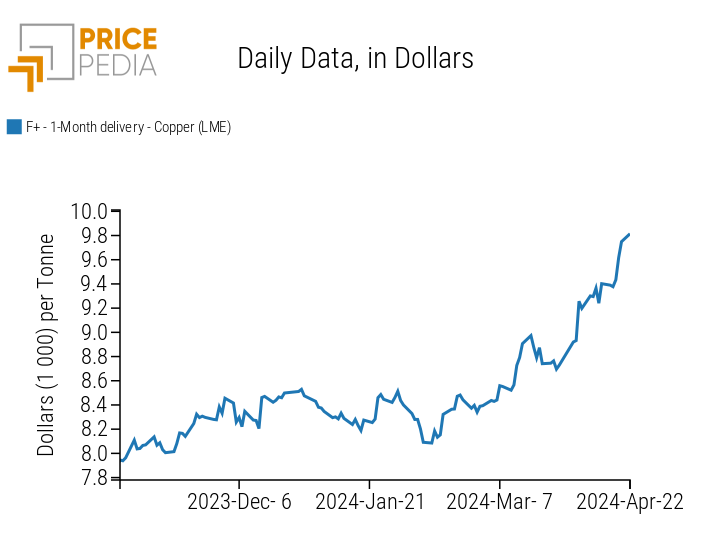
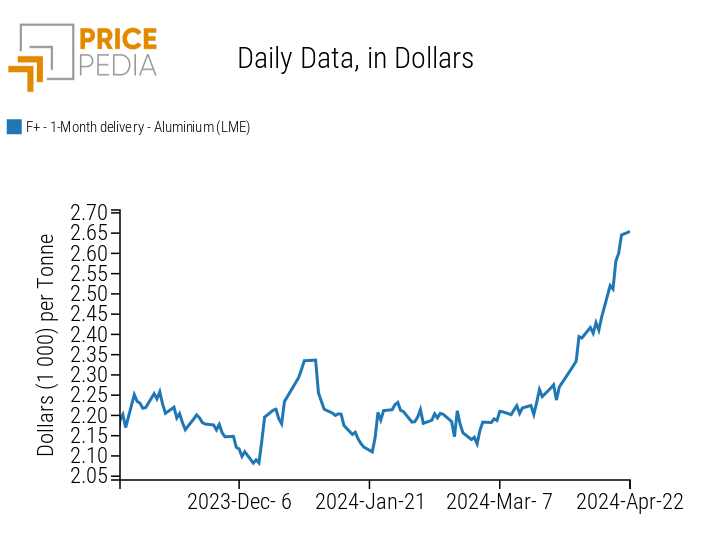
As evidenced by the graphs below, copper and aluminium prices, quoted on the LME market, have experienced strong positive fluctuations.
| Spot price of copper quoted on the London Metal Exchange (LME) | Spot price of aluminium quoted on the London Metal Exchange (LME) |
|
|
Some analysts have interpreted the recent increase in copper and aluminium prices as the effect of new policies by Chinese companies aimed at securing significant quantities of the main non-ferrous metals before their prices rise due to expected demand growth driven by the energy transition. This hypothesis seems not to be confirmed by two facts:
- over the past two months, the price of copper in dollars on the LME and CME has increased by over 12%, while in the Shanghai market, the growth has not reached 10%;
- in the Chinese market, the demand and supply of copper have found a new balance after the excess demand recorded in the 2021-2022 biennium. See the article Minerals, metals and semi-finished products: the case of copper
However, the issue is debated and particularly important for analyzing the possible future dynamics of non-ferrous metal prices.
ENERGY
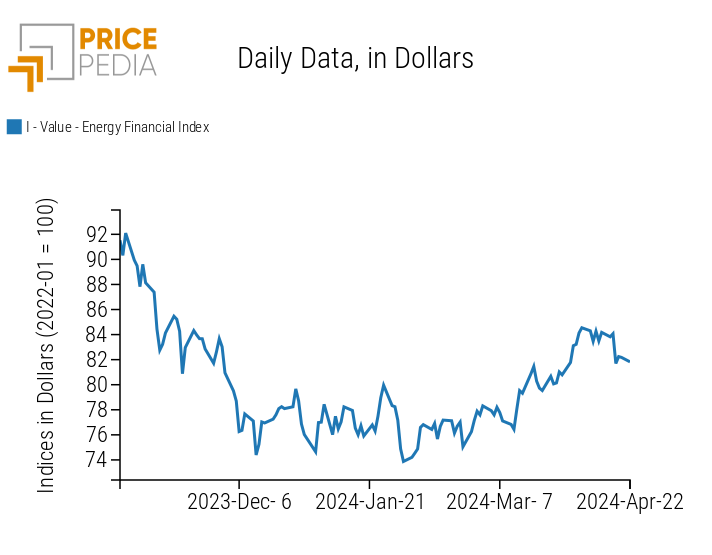
This week, the financial index of energy prices recorded a slight decrease in line with Brent's performance.
PricePedia Financial Index of energy prices in dollars
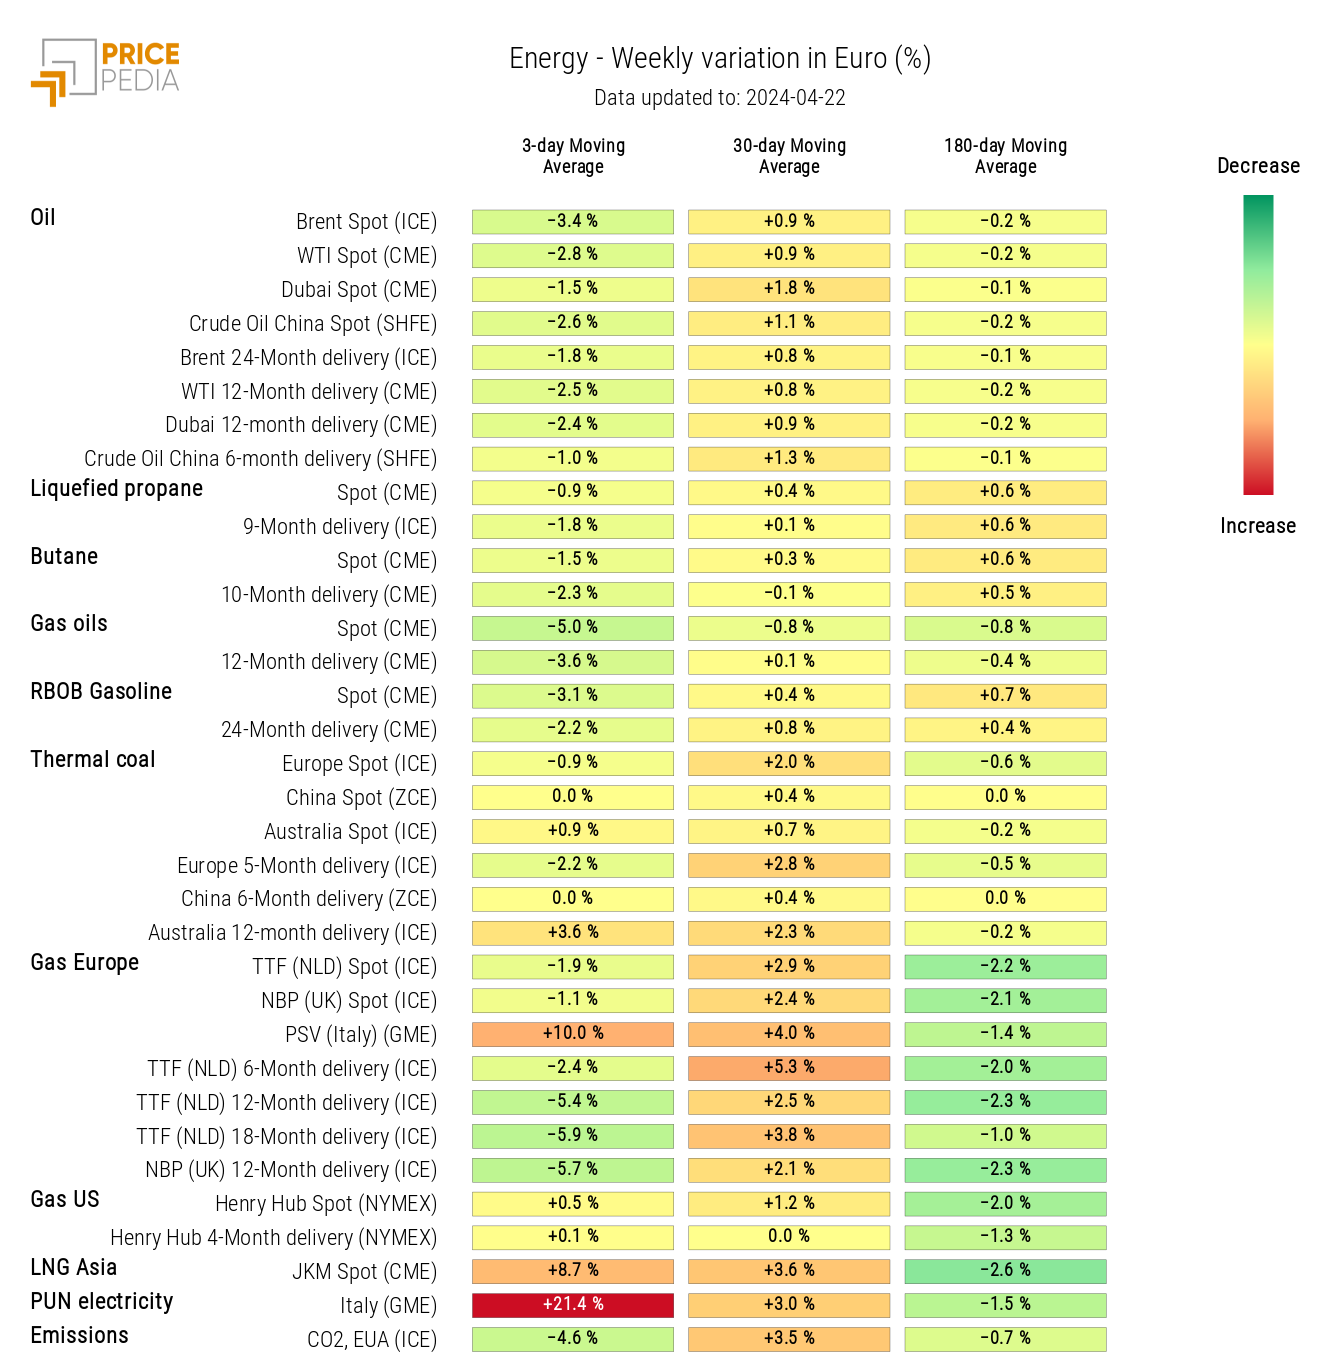
The energy price heatmap highlights strong increases in the price of Italian electricity and PSV.
HeatMap of energy prices in euros
PLASTICS
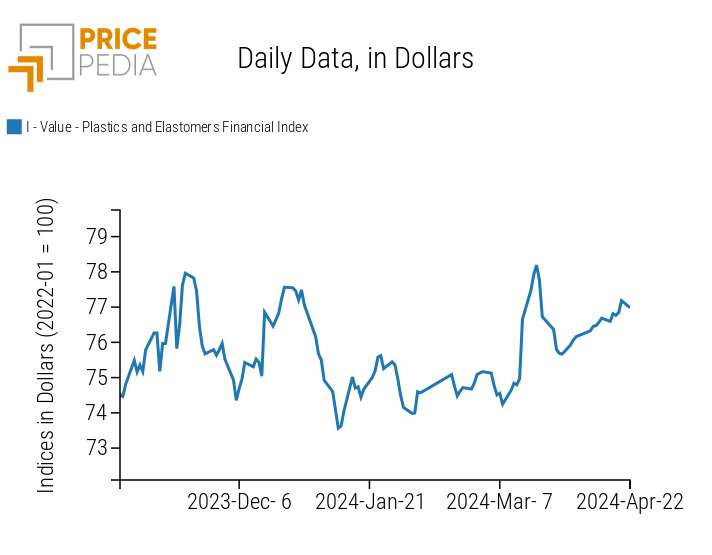
The financial index of plastics quoted in China continues to rise, driven this week by linear low-density polyethylene (LLDPE) prices.
PricePedia Financial Indices of plastics prices in dollars
FERROUS
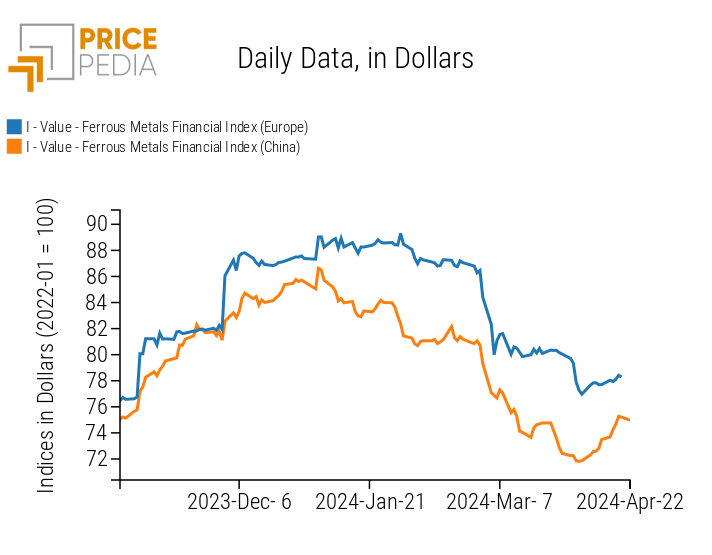
This week saw an increase in ferrous prices, more pronounced for the Chinese market index.
PricePedia Financial Indices of ferrous metals prices in dollars
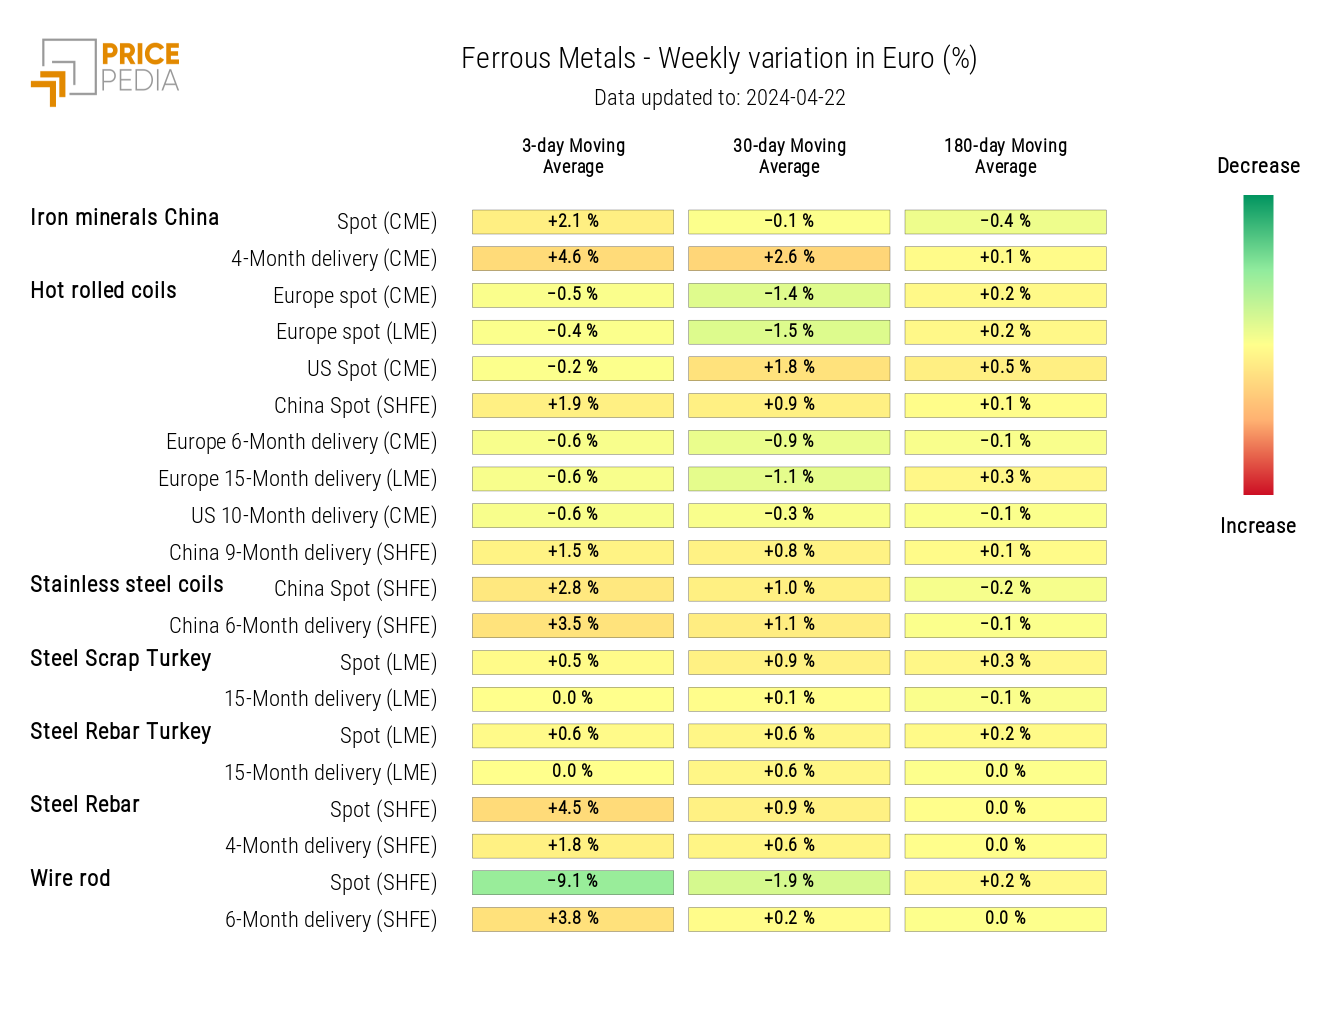
The ferrous heatmap shows an increase in SHFE steel rebar and CME-listed iron ore prices, against a fall of wire rod prices.
HeatMap of ferrous metals prices in euros
Do you want to stay up-to-date on commodity market trends?
Sign up for PricePedia newsletter: it's free!
INDUSTRIAL NON-FERROUS
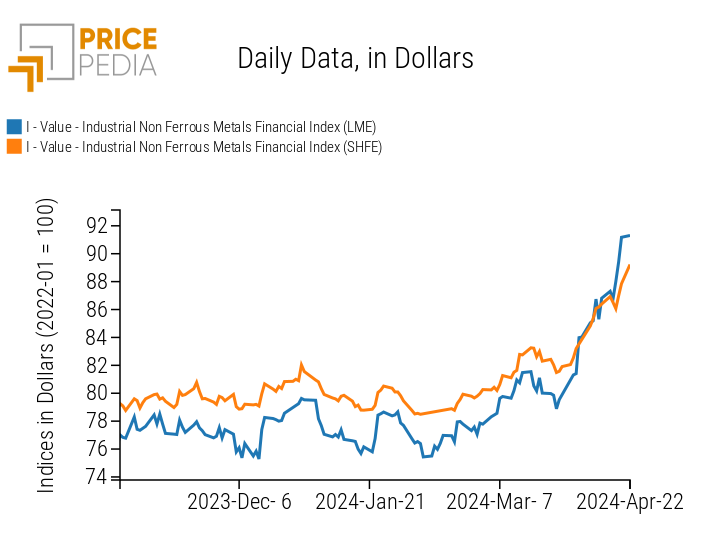
The LME non-ferrous index continues to show a strong rise, accentuated by the ban on the delivery of new Russian metals to LME warehouses. In contrast, the SHFE non-ferrous index remains relatively stable over the past week.
PricePedia Financial Indices of industrial non-ferrous metals prices in dollars
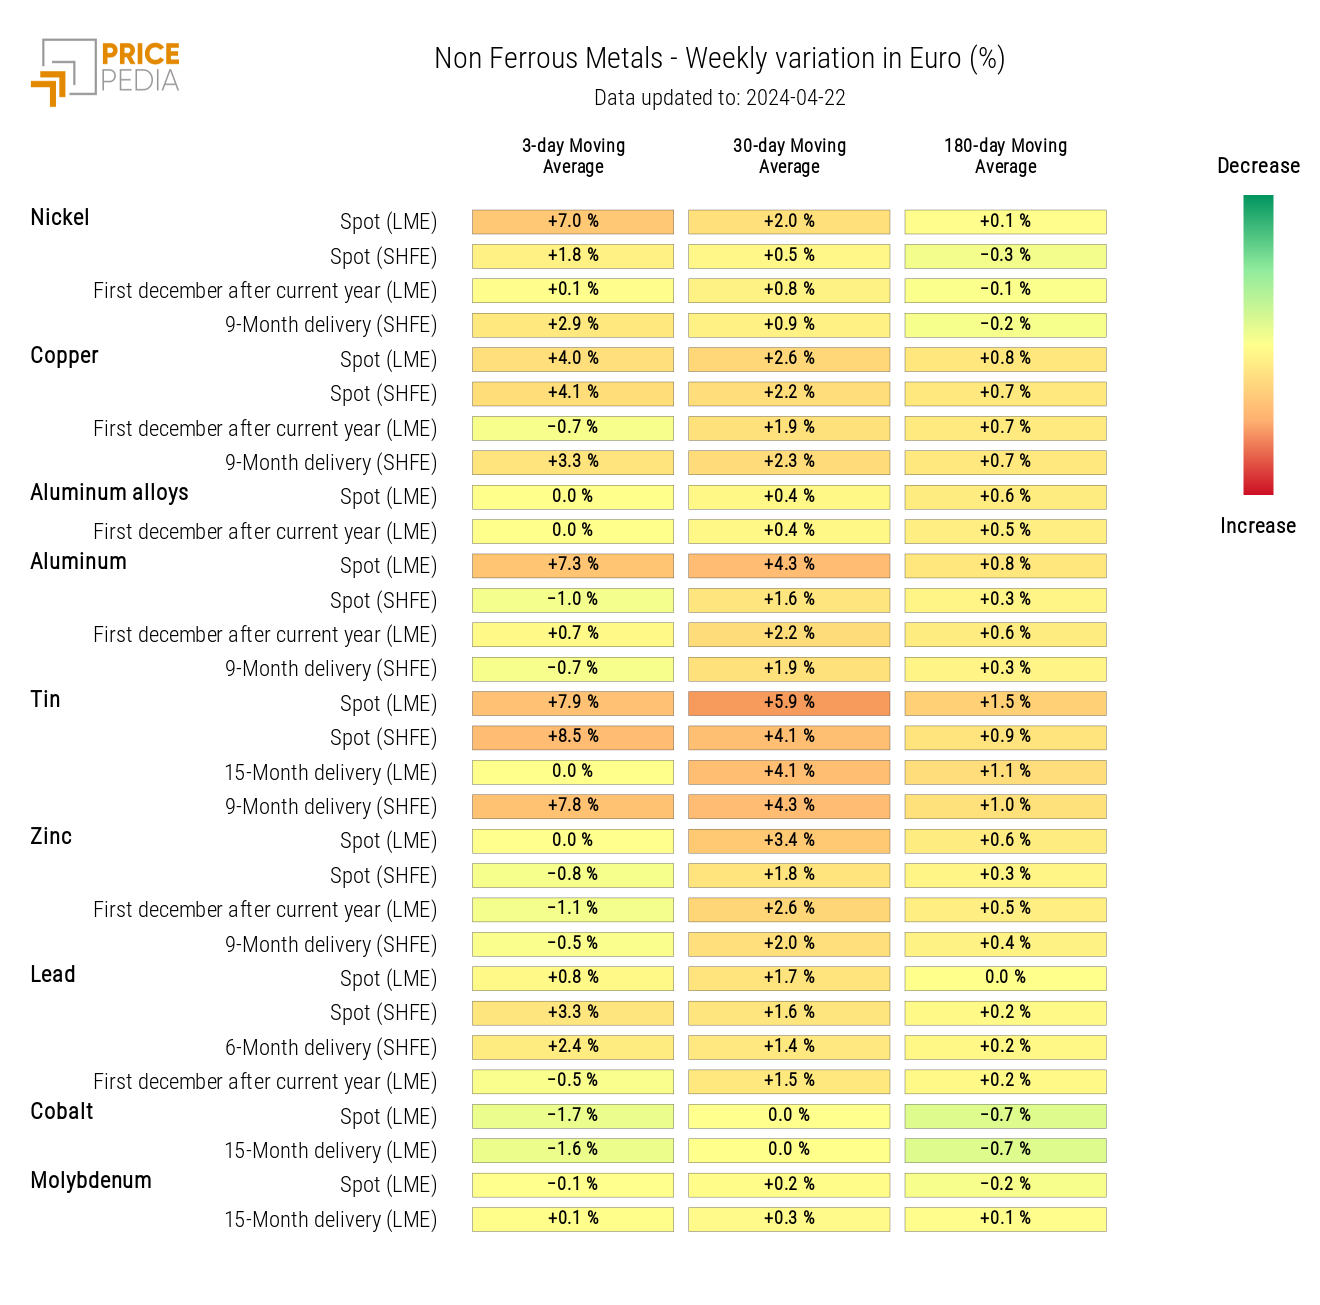
The non-ferrous heatmap shows a more pronounced increase in prices for the LME market compared to the SHFE market, except for tin prices.
HeatMap of industrial non-ferrous metals prices in euros
FOODSTUFFS
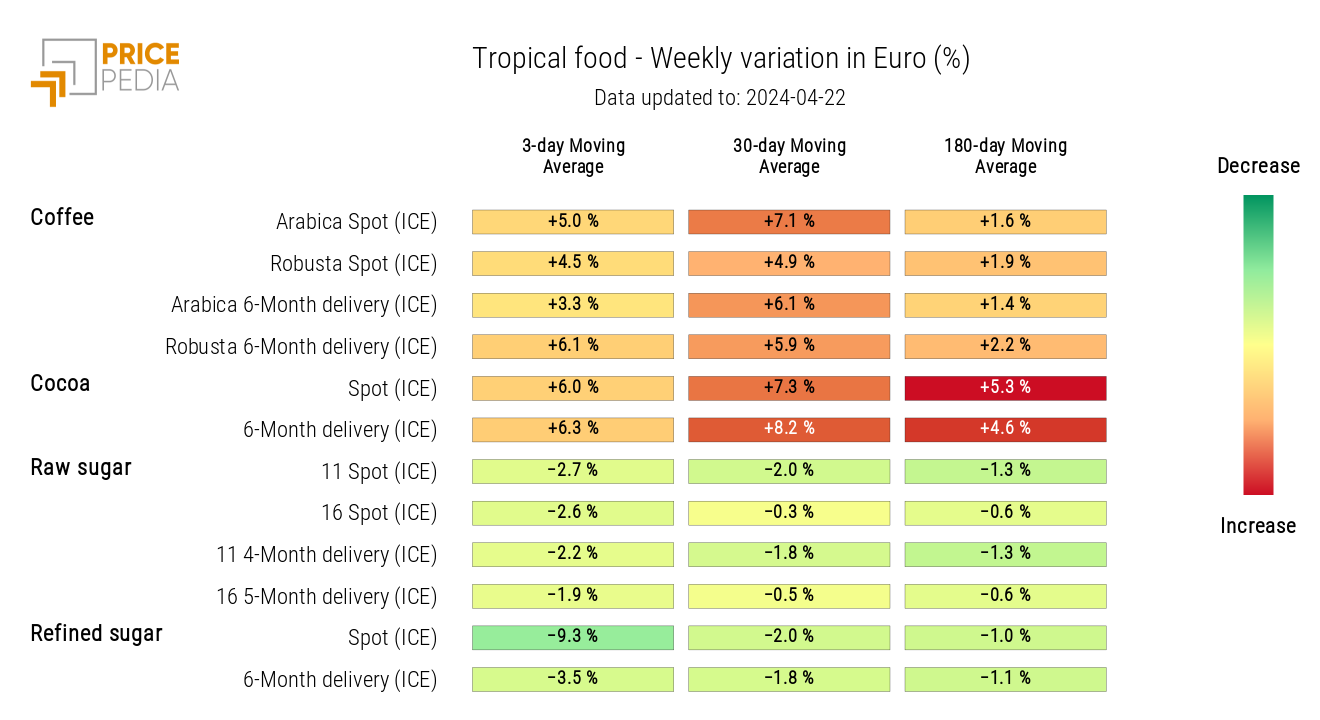
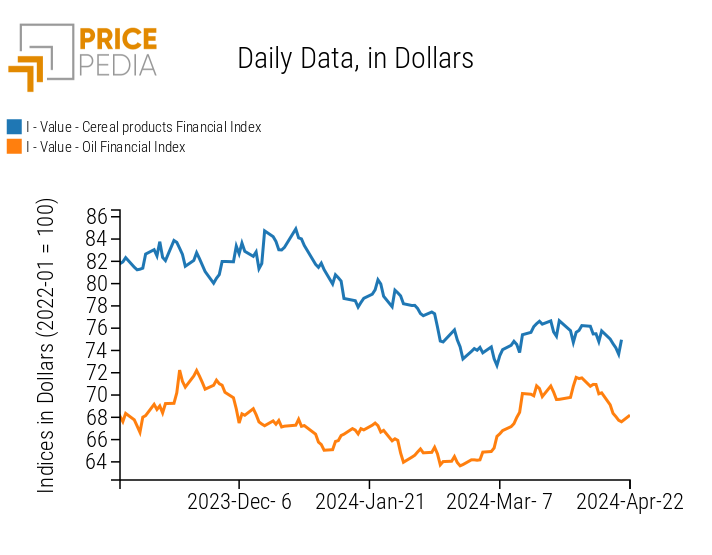
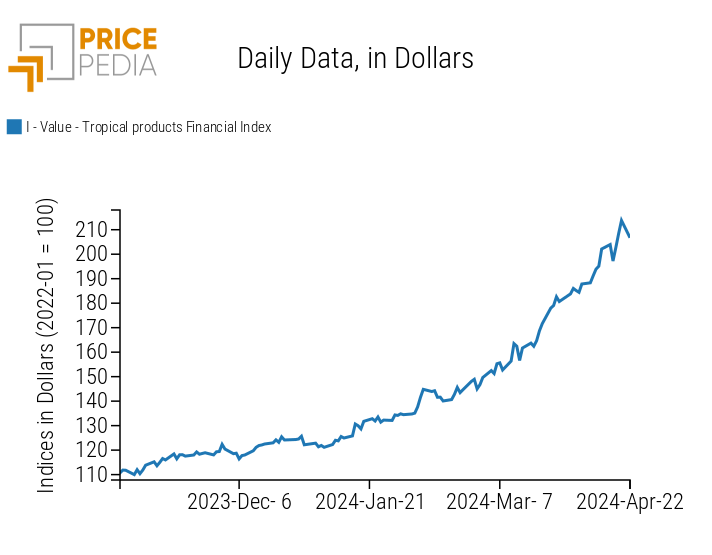
Financial indices of cereals and edible oils show price declines, while the index of tropical foodstuffs continues its upward trend, driven, even in the most recent days, by the rise in coffee prices.
| PricePedia Financial Indices of food prices in dollars | |
| Cereals and Oils | Tropical |
|
|
TROPICAL
The tropical foodstuffs heatmap shows a particularly intense increase in coffee prices.
HeatMap of tropical food prices in euros
