Minerals, metals and semi-finished products: the case of copper
The single world financial and physical price of copper makes it uncertain to read the current conditions of the different regional markets
Published by Luigi Bidoia. .
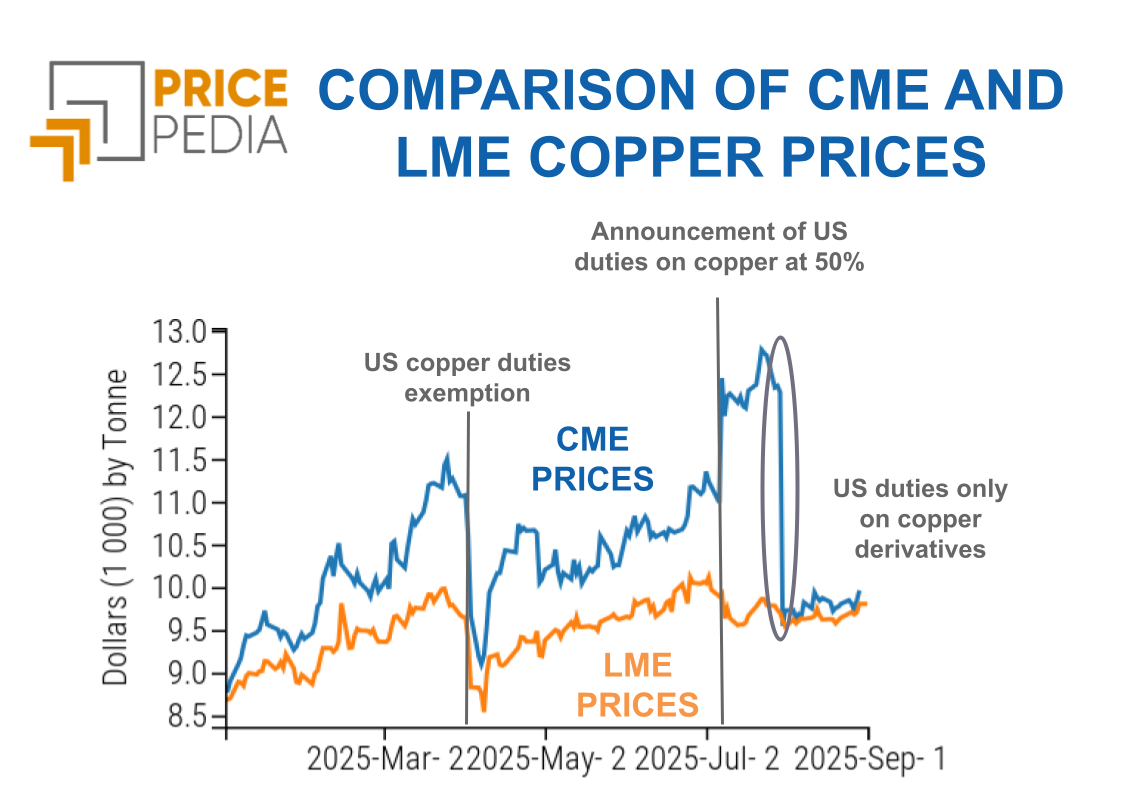
Copper Price DriversThe copper market, along with the oil market, are the two commodity markets whose prices are formed day by day on the global financial market. Copper is listed on three different exchanges: the London Metal Exchange (LME), the Shanghai Futures Exchange (SHFE), and the Chicago Mercantile Exchange (CME). Thanks to sophisticated arbitrage operations by specialized traders, there is an almost perfect alignment of copper prices across these platforms, despite regional differences in demand and supply. Chart 1 below accounts for this alignment among the three different financial prices.
Price of copper cathodes (dollars/tonne)
| Chart 1: Comparison of 3 financial markets | Chart 2: Comparison of 3 physical markets |
 |
 |
The existence of a single global financial price for copper has significant effects on the physical prices in various global economic areas.
In theory, the price of a commodity should be determined by the intersection of demand and supply in the physical market and influence the financial market in such a way that prices tend to converge to the physical price at the delivery date. However, the copper market deviates from this model. Indeed, if it adhered to it, the financial prices would likely differ among the various exchanges, influenced by the regional prices of the underlying asset. Instead, the opposite occurs. The convergence of the three financial prices results in a perfect convergence of the physical prices of copper across different markets, regardless of the varying conditions of demand and supply that may characterize them.
The Chart 2 above shows the prices of copper cathodes in the physical markets of the USA, EU, and China. The substantial alignment of these three prices is evident.
An additional element of great interest is the correspondence between the average price of copper quoted on the three financial markets (LME, SHFE, CME) and the average physical price of copper in the markets of the USA, the EU, and China. The following chart compares these two average prices, highlighting the high degree of uniformity.
Price of copper cathodes in financial and physical markets

The empirical analysis thus demonstrates the existence of a single global copper market that establishes a unique global price, applicable both to financial and physical markets. Considering that for over a quarter of a century the conditions of demand and supply in the physical markets of the USA, EU, and China have hardly been similar enough to generate a single global price through the mere mechanism of supply and demand, it is deduced that the physical prices necessarily follow the financial ones. This process suggests that the price of copper is largely determined in the financial markets, reflecting the expectations and strategies of investors more than the immediate physical market conditions.
An Alternative Measure of Supply and Demand Conditions
The 'financial' nature of the global single price of copper makes it opaque in relation to the current supply and demand conditions of the various regional physical markets.
However, information on the conditions of the different markets can be derived by analyzing the prices of upstream (copper ores and scrap) and downstream (semi-finished copper products) products in the copper supply chain. The prices of upstream and downstream products tend to be less affected by financial prices and more by the supply and demand conditions of the various physical markets.
Copper ore and scrap prices
The following table lists the prices of copper ores (first two rows) and copper scrap (last two rows) recorded by the import flows of the EU and China. The middle row reports, for comparison, the EU price of copper cathodes (which we have seen to coincide with the global single price).
Price of copper ores and scrap in the world (dollars/tonne)

From the analysis of these data, it is possible to derive a signal of increased tensions between demand and supply in China during 2021 and part of 2022, corresponding to the peak values recorded by the price of copper. In the following months, the market progressively rebalanced, with greater alignment between demand and supply in the EU market and especially in the Chinese market. If we consider the prices of copper ores and scrap in China and the EU, against a price aligned in 2019, prices in China have indeed increased at higher rates during the 2020-2021 biennium, indicating greater market tension in this area. Subsequently, they have significantly reduced in the face of a slight growth between 2022 and 2024 of the corresponding prices in the EU.
Do you want to stay up-to-date on commodity market trends?
Sign up for PricePedia newsletter: it's free!
Prices of some semi-finished copper products
The following table lists the prices of some semi-finished copper products, traded both on the EU market and on the US and Chinese markets.
Price of semi-finished copper products in the world (dollars/tonne)

In this case, the peak price for all products is recorded in 2022, consistent with the existence of a time lag between changes in the price of copper and those of its semi-finished products.
Even in the case of semi-finished products, during the 2021-2022 price increase phase, the most intense variations were recorded in the Chinese market and, to some extent, in the American market. In the subsequent phase of market rebalancing, decreases were recorded in China, while in Europe and partially in the United States, prices did not decrease but increased slightly even in more recent years.
The overall analysis of price dynamics
The analysis of the price dynamics of upstream and downstream commodities of copper cathodes clearly indicates how the physical market where the most pronounced changes in supply and demand conditions occurred was the Chinese market, with an excess of demand in the 2021-2022 biennium, which progressively returned to normal in the subsequent period.
Conclusions
Copper, like oil, is characterized by the existence of a single global price determined by financial markets, to which the price of copper cathodes in physical markets aligns quickly and perfectly.
The analysis of the dynamics of physical prices upstream and downstream of the copper cathode indicates the Chinese market as the one where the imbalances between demand and supply were most significant, determining prices from which it is possible to extract signals about the historical evolution of the conditions of abundance or physical scarcity of the metal.
Given the larger size and high degree of competition of the Chinese market, it is likely that the most intense price variations on physical markets will continue to be recorded in China in the future, suggesting a specific monitoring of Chinese prices upstream and downstream of the copper supply chain. This information, along with the single price determined by financial markets, will complete the picture of the global copper market situation.
You may be interested in:

LME copper price forecasts
Published by Luca Sazzini. .
Copper Non Ferrous Metals ForecastWhat price levels can be expected for LME copper in 2026–2027? [ Read all ]
Trump's game on copper tariffs
Published by Luca Sazzini. .
Copper Non Ferrous Metals USA customs duties Import tariffsUS tariffs: why is copper different from steel and aluminium? [ Read all ]

US duties on copper: the reasons and expected effects on prices
Published by Luca Sazzini. .
Copper Non Ferrous Metals USA customs duties Import tariffsFinancial markets remain uncertain on U.S. duty announcement on 50% copper [ Read all ]