What price risk for commodities in 2024 and 2025?
PricePedia Scenario April 2024
Published by Pasquale Marzano. .
Last Price Forecast
The PricePedia Scenario has been updated with information available on April 4, 2024. It shows the substantial stability in 2024 of the global industrial cycle, supported, at least in the first part of the year, by the resilience of American manufacturing more than by a generalized recovery. In Europe, in fact, there is still a phase of weakness in industrial production (see the update First signs of global industrial recovery). This weakness, combined with the reduction in Euro Area inflation, tends to reinforce expectations of an upcoming easing of restrictive monetary policies in June 2024, and consequently, a recovery in European manufacturing already during this year.
The following graph shows the forecast scenario of the global industrial cycle index[1] developed by PricePedia.
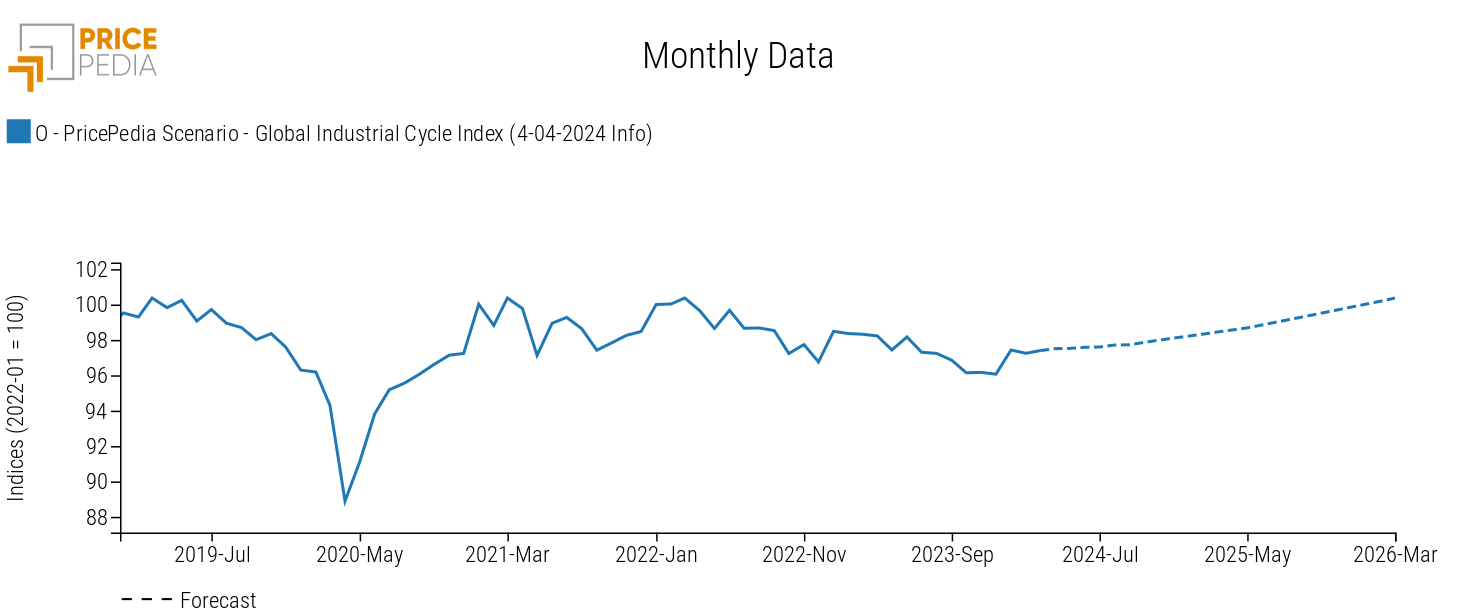
The monthly dynamics of the index show growth starting from early 2024. On an annual average, the global industrial cycle presents a generally stable trend (+0.25% compared to the average values of 2023). In 2025, the recovery is more intense, at +1.4%, and continues throughout 2026. This corresponds to an average annual growth of global industrial production of over +3% in both 2025 and 2026.
Do you want to stay up-to-date on commodity market trends?
Sign up for PricePedia newsletter: it's free!
Commodity Price Forecast
The 24-month scenario for prices related to the main commodity categories (Industrial[2], Total commodities[3], Energetic, and Food) is shown below.
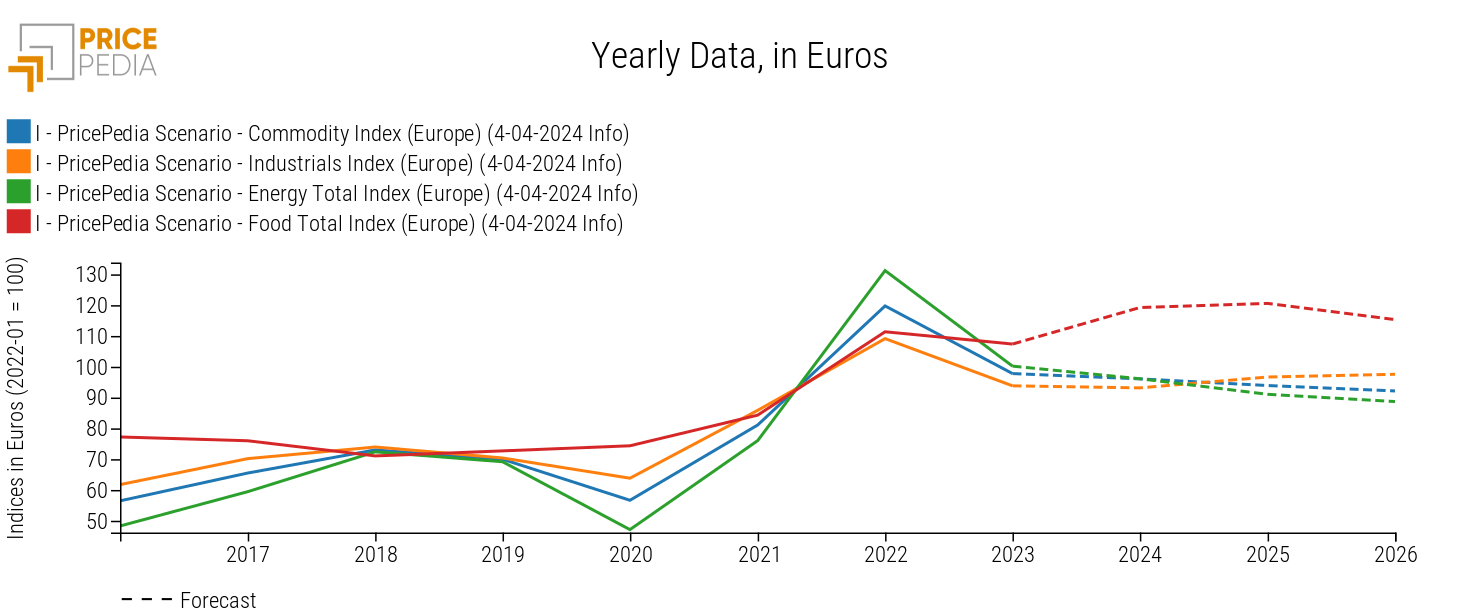
The next phase of commodity price increases will have a relatively modest intensity overall. In aggregate terms, the effect of the reduction in the price of energy raw materials will result in a reduction in the total price of commodities in euros of around -2% annually over the 2024-2026 triennium. Considering prices in dollars, the intensity of the reduction is halved, given the expected depreciation of the US dollar by 1% annually in the near future.
Regarding industrial commodity prices, in 2024, in euros, there is still a negative variation (-0.7%), while in the 2025 average, there will be an increase of almost +4%.
However, the scenario of limited price risk discounts the risks that could manifest not only at the level of individual commodities but also at the aggregate level. The sources from which these risks originate are:
- possible anticipation by financial markets of increased demand for certain commodities linked to the energy transition, such as copper;
- possible financial speculation in the face of geopolitical tensions;
- reduction in supply diversification, in the face of a deglobalization of global commodity trade.
In general, upside risks are greater than downside risks. However, in the case of certain specific commodities, significant downside risks cannot be ruled out, especially for those goods whose prices saw strong increases in the 2021-2022 biennium, without registering equally intense decreases in 2023, and whose current levels seem unsustainable.
An example in this regard is given by electrical steel prices, where the risks of reduction are high, given current quotations that are still twice as high as those in 2020.
| 2020 | 2021 | 2022 | 2023 | 2024 | |
|---|---|---|---|---|---|
| D-Last Price EU-Hot-rolled electrical steel N.G.O. (width ≥ 600mm) | 596 | 845 | 1038 | 948 | 916 |
| D-Last Price EU-Cold-rolled electrical steel N.G.O. (width ≥ 600mm) | 682 | 967 | 1507 | 1447 | 1395 |
| D-Last Price EU-Electrical steel N.G.O. (width < 600mm) | 768 | 1043 | 1774 | 1873 | 1757 |
| D-Last Price EU-Electrical steel G.O. (width ≥ 600mm) | 1149 | 1787 | 2852 | 2956 | 2332 |
| D-Last Price EU-Electrical steel G.O. (width < 600mm) | 1798 | 2138 | 3536 | 4016 | 3588 |
1. The global industrial cycle index is constructed by purifying the actual dynamics of industrial production from its trend. Since the supply of commodities tends to vary according to long-term economic growth expectations, while the demand for commodities is more linked to actual cyclical uses, the global industrial cycle index tends to reproduce the conditions of tension between demand and supply on the commodity market: when it increases, it means that the demand for commodities increases more than the supply; vice versa when it decreases.
2. The PricePedia Industrials index results from the aggregation of the indices relating to the following product categories: Ferrous, Non-Ferrous, Wood and Paper, Chemicals: Specialty, Organic Chemicals, Inorganic Chemicals, Plastics and Elastomers and Textile Fibres.
3. The PricePedia Total Commodity index results from the aggregation of the indices relating to industrial, food and energy commodities. Pasquale Marzano
Economist and data scientist. At PricePedia he deals with the analysis of commodity markets, forecasting models for raw material prices and management of reference databases.
