PricePedia's 2024 development projects
After developing the V4 version, PricePedia continues its innovation process
Published by Luigi Bidoia. .
Strumenti Management Analysis tools and methodologiesWith version V4, PricePedia has made a qualitative leap in the ease of use of the platform and the features available. Thanks to the guaranteed price commercial policy, all subscribers prior to 2023 can benefit from PricePedia improvements, keeping the price of their subscription unchanged. 2024 will also be a year of strong innovations, which will develop along 4 directions:
- PricePediaGPT: is a chatbot developed through ChatGPT, capable of conversing with users on topics relating to prices and markets for purchasing materials;
- expansion of the databases, through the insertion of new data sets regarding both financial markets and physical markets;
- widening of the forecast scenario at all prices EU customs monitored;
- addition of new data visualization features and new statistical tools for extracting information from numerical data.

PricePediaGPT
Last year, ChatGPT introduced to the general public the potential of Large Language Models (LLM), i.e. advanced Generative Artificial Intelligence systems capable of interacting with users in natural language. The new frontier is now the application of Generative Artificial Intelligence to analyze specific data sets.
In this context, PricePedia magazine represents an ideal source for exploring information extraction capabilities through human language conversations. The nearly 1,500 articles published in PricePedia magazine over the last five years offer a valuable textual resource, providing detailed insights into price dynamics and the characteristics of various commodity markets.
The PricePedia IT team has already developed an extension of the ChatGPT environment which, compared to a
question from the user, is able to search for Pricepedia articles that deal with the topic,
providing the user with a response in human language, based on the summary of their content.
This tool aims to make commodity market analysis and pricing information more easily accessible, allowing users to get detailed answers through an intuitive conversational interface.
Expansion of the database
Data on commodity prices distributed by PricePedia essentially come from two sources: regulated financial markets and national statistical offices around the world.
Regulated financial markets
Currently, in the Daily Data Prices section of PricePedia, you can find spot prices and futures prices published daily by 6 regulated markets:
- London Metal Exchange (LME): is one of the largest non-ferrous metals markets in the world. It represents a particular case due to the importance of the physical delivery of the metals in closing contracts, facilitated by the various LME certified warehouses located in various parts of the world.
- Chicago Mercantile Exchange (CME): is the result of an aggregation process of various American regulated markets, including the Chicago Board of Trade (CBOT), the New York Mercantile Exchange (NYMEX) and Commodity Exchange, Inc. (COMEX). It is one of the largest financial markets in the world for trading futures and options on a wide range of commodities.
- Intercontinental Exchange (ICE): is made up of a global network of exchanges and clearing houses for financial and commodity markets, including ICE Futures Europe (where Brent oil is listed), ICE Futures U.S and ICE-Endex (European Energy Derivatives Exchange). This network also includes the New York Stock Exchange (NYSE).
- Shanghai Futures Exchange (SHFE): one of China's main futures markets, specialized in metals' trading.
- Dalian Commodity Exchange (DCE): futures market in China specialized in trading agricultural commodities and some industrial products, such as coke and coal.
- Zhengzhou Commodity Exchange (ZCE): futures market in China specialized in trading of chemicals and some agricultural products.
- Australian Wool Exchange (AWEX): market specialized in wool trade.
During 2024, this section will be expanded by adding daily prices published by other major regulated exchanges, such as Tokyo Commodity Exchange (TOCOM), Bursa Malaysia Derivatives (BMD) and Multi Commodity Exchange of India (MCX).
Physical markets
Among the monthly data currently published by PricePedia, you can find three sections:
- EU customs prices: customs prices of trade between EU countries with other EU countries and with non-EU countries, with a product detail at the 8-digit Combined Nomenclature level;
- US customs prices: customs prices for trade between the US and partner countries, with a 10-digit Harmonized System level product detail;
- EU producer prices: surveys of producer prices carried out by EU countries' central statistics institutes and collected by Eurostat. Producer prices relate to the prices of actual transactions carried out by companies operating in EU countries towards other companies of the same nationality or abroad. The classification used to collect production prices is the ATECO classification (relating to economic activities), with a 4-digit economic activity detail. Even if available only at a relatively high level, producer prices can be useful to complement customs information when it is highly dispersed.
During 2024 these sections will be integrated with two other sections:
- ASIA customs prices: concern the customs prices for trade in the main Asian industrialized countries. For many years, Asia has become the economic area with the highest consumption of conveniences. In many cases, the price of a commodity is formed on the Asian market. Price changes on the Asian market contaminate commodity price changes on other markets in the world, often in a decisive way. Often the dynamics of commodity prices on the Asian market anticipate the dynamics of commodity prices on the European market.
- USA producer prices: through a monthly survey of over 16 thousand factories, the US Bureau of Labor Statistics produces the Producer Price Index (PPI) of almost 4000 commodities and basic goods. This database of producer prices is by far the most widespread and detailed survey of commodity prices in a specific market.
Expansion of the forecast scenario
There are two main approaches to forecasting economic variables such as commodity prices, each with its own process and assumptions.
Theoretical models
The first approach is based on the use of theoretical models. In this approach, the starting point is the identification of a specific economic model, chosen by the researcher on the basis of his or her knowledge of the subject. Subsequently, we proceed with the estimation of the model parameters using empirical data. This step may include adjusting the initial model to improve its ability to faithfully represent the observed data. Finally, the estimated model is used to generate forecasts, conditioned by specific scenarios for the exogenous variables.
Statistical models
The second approach, however, focuses on statistical models. In this case, the goal is to identify patterns in historical data without relying on pre-existing economic theory. Once the most representative pattern has been identified, this is used to project the future evolution of the variable of interest. In this case, the researcher's specific knowledge of the economic context is not required; the prediction depends solely on the quantity and quality of the available data and the stability of the identified patterns over time.
In recent years, the development of machine learning techniques and the increase in data availability have made the second approach increasingly popular, thanks above all to its ease of use. In particular, in the financial sector, there is a growing tendency to adopt these methodologies also for forecasting commodity prices.
Limitations of statistical models
The approach based exclusively on machine learning techniques for statistical analysis presents two main challenges. The first concerns the time horizon of the forecasts. The reliability of forecasts obtained through large volumes of data, collected at high frequency, tends to be higher in the short term. As a result, the useful time horizon of forecasts may be limited to a few days or, in some contexts, even a few hours. The second challenge is related to understanding causal dynamics: purely statistical models often do not offer intuitive explanations in terms of causes and effects, thus making the interpretation of results a complex issue.
This approach is very useful when decisions need to be made frequently and you can act quickly on new information, such as in financial trading. In these scenarios, any losses related to incorrect predictions can be quickly offset by gains resulting from correct predictions, provided that the model is globally reliable.
Predictions for purchasing decisions
Decisions managed by purchasing departments are clearly distinct from the context of financial trading, mainly due to the lower frequency of decisions and the difficulty of quickly recovering from any losses. In this context, the ability to analyze and understand cause and effect relationships plays a crucial role. Accurately assessing the robustness of a forecast and communicating it clearly to other stakeholders is essential to ensure that purchasing decisions are well-founded and shared.
For the decisions of a purchasing department, price forecasts based on the theoretical modeling approach may be more useful. This preference is justified by the generally longer time horizon of purchasing decisions, often exceeding a month, and the need to understand the underlying mechanisms that drive forecasts. Theoretical analysis offers a structure for interpreting market dynamics and for designing strategies based on a well-articulated scenario of causes and effects, making this approach particularly suitable for dealing with complex decisions whose effects do not end in the short term.
PricePedia's approach to forecasting
To develop its forecast scenarios, PricePedia adopts a hybrid approach that combines a solid theoretical basis, essential for understanding long-term dynamics, with statistical tools aimed at accounting for short-term fluctuations. These approaches are contained in the so-called dynamic specification models, which have demonstrated their effectiveness in forecasting monthly prices over a period of several years.
The model identification phase requires an adequate understanding of the commodity market in question. In this context, the PricePedia team of researchers is continuing a gradual process of identifying and estimating models for all prices in the EU customs prices section. This ambitious operation is expected to be completed by the end of 2024.
New Features and Tools in PricePedia
Extracting information from datasets is made more accessible thanks to the introduction of specific visualization features and advanced statistical tools. PricePedia considers this a process of continuous improvement, given the vast range of potential offered by both data visualization and new statistical tools.
Data Visualization Features
A significant PricePedia innovation of 2024 was the introduction of a feature for creating custom data presentation tables. This allows users to select data series of interest, change their periodicity and time interval, and transform rows into columns (and vice versa). It is also possible to replace the values of the observations with rates of change compared to previous periods or compared to 2019, the reference year considered "normal" before the pandemic and the recent raw materials crises.
Plans for 2024 include:
- inclusion in the graphs of moving averages of a time length chosen by the user, to identify the so-called golden crosses and dead crosses, indicators of trend changes;
- calculation of the real prices of a commodity, corrected for the effects of inflation;
- implementation of a double scale in the graphs, to effectively analyze the relationships between prices with different degrees of variability.
Statistical Tools
In 2023, PricePedia has enriched its offering with new statistical tools for time series analysis, including:
- partial correlation matrices, useful for identifying direct relationships between two time series, excluding indirect influences due to other variables. This tool allows, for example, to analyze the direct link between the prices of petrol and diesel, net of the effects that the price of oil has on both;
- ARIMA models, for statistical forecasts on a single time series. These models, representing a simplified form of machine learning, explore whether a set of data follows specific regular patterns. Once these patterns are identified, they can be used to predict the future evolution of the series in question.
In 2024, PricePedia will further expand its range of statistical forecasting models to also include multivariate models, which examine patterns of regularity not only within a single time series but also across multiple series.
You may be interested in:

The direct effects of Natural Gas on procurement materials
Published by Pasquale Marzano. .
Strumenti Natural Gas Analysis tools and methodologiesWhich products are most exposed to recent fluctuations in energy inputs? [ Read all ]

The arrival of foundation models in time series forecasting
Published by Riccardo Gentilucci. .
Strumenti Machine learning and EconometricsNew Machine Learning Forecasting Systems [ Read all ]
Tokens & Transformers: the heart of modern Machine Learning models
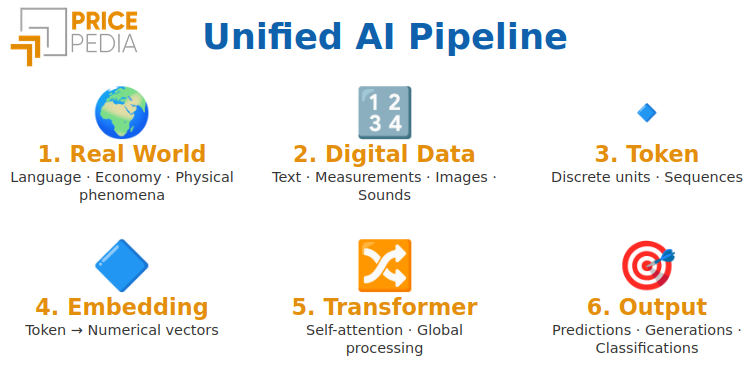
Published by Luigi Bidoia. .
Strumenti Machine learning and EconometricsCome una tecnologia unificata ha accelerato l’evoluzione dell’AI [ Read all ]