PricePedia V4: more data and new tools
PricePedia: V4 version replaces V3
Published by Luigi Bidoia. .
Strumenti Analysis tools and methodologiesFrom October 2023 it was available at v4.pricepedia.it the v4 version of PricePedia. From today this version will be accessible at the PricePedia base address (www.pricepedia.it). The V3 it will remain accessible for a few more months at v3.pricepedia.it .
This article describes:
- the different data structure of the two versions;
- the new Download Data tool, available only in the V4 version;
- the new data section Producer Prices, accessible only in version V4;
Data structure of the two versions
The element that most distinguishes the V4 version from the V3 version is their data structure.
In the previous version, each time series was contained in a single data set. In the new version, multiple time series are grouped into a single dataset. This allows you to optimize their management and be able to choose the data of interest in two distinct and simplified steps: first the user chooses the data set of interest, accessing the default series, and subsequently can modify the choice of the series of interest , specifying its measurement.
The individual data sets are organized by different criteria, which correspond to different measures, as illustrated in the following figure.
Specifications of the different time series in PricePedia V4
| Customs prices | Daily financial prices | |
|---|---|---|
|
|

|
Customs prices
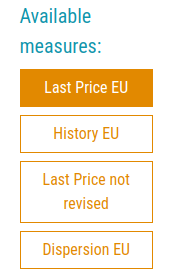
For example, in the case of customs prices the data set is defined by the commodity of interest. Once the commodity has been chosen, via the available measures menu it is possible to choose the specific historical series:
- Last price EU: price series developed by PricePedia with nowcasting techniques to update customs data in real time;
- Historical EU: customs price series, as shown by the declarations of companies from the 27 EU countries;
- Last price EU not revised: represents the update of the Last Price EU historical series, without modifying the values published in the previous months;
- EU dispersion: measures the dispersion of customs price surveys in each month and allows an immediate evaluation of the EU market forces to form a single price or not.
Daily financial prices
In the case of daily financial prices, the data set is defined by the commodity, whose price represents the underlying of the various spot and future prices reported.
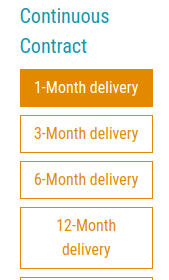
Through the Futures Contract menu it is possible to choose the historical series of the future that expires in a specific month. Using the Continuos Contract menu it is possible to choose the historical series of prices expiring at time intervals (1 month, 3 months, 6 months, etc.)[2].
Download data
A new Download Data tool has been added in the V4 version of PricePedia. This tool allows you to preselect up to 99 time series which can be downloaded into an Excel sheet at any time. In this way, the user can build his own database in Excel, which can be updated as desired via the Download button.
The pre-selection of the series of interest takes place in the Product Selections phase. Next to each selected product there is the icon
which allows you to select the product of interest.
All the selected products are inserted by the system into a special table which can be accessed via the menu item TOOLS > DOWNLOAD DATA
Download Data Table
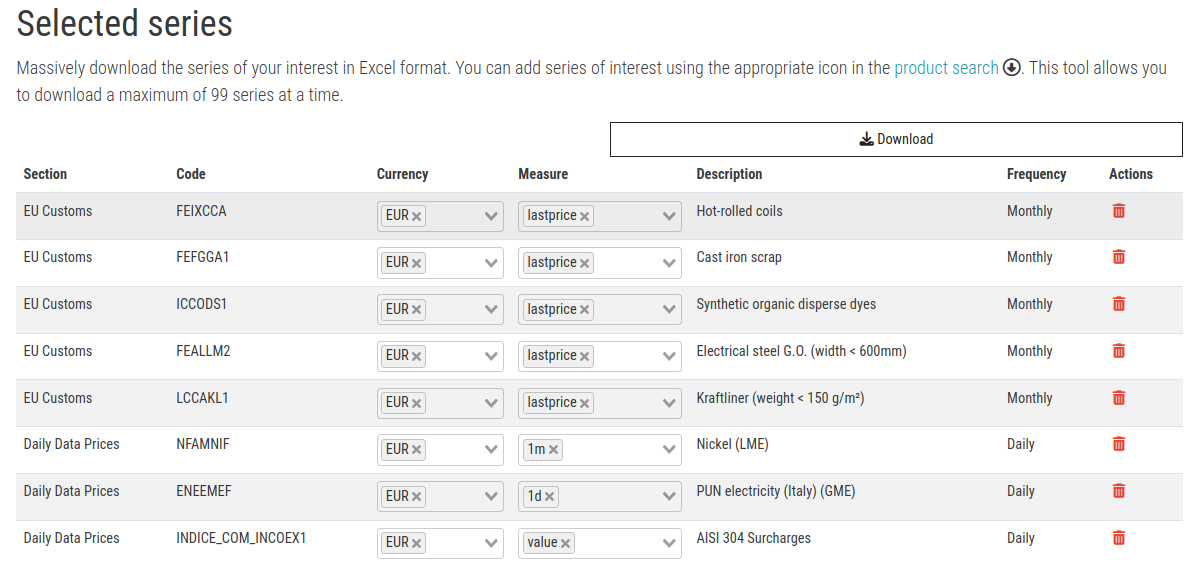
With the Download button it is possible to download the selected time series into an Excel file. The output excel file contains three sheets:
- Metadata which describes the downloaded series and reports the code to identify the columns containing the different data;
- Monthly data containing the downloaded monthly time series;
- Daily data containing the downloaded daily historical series;
The download operation can be done at will by the user. For each request, PricePedia will download the series with all the information available at that moment, allowing the user to always have an Excel file with the historical series of interest always updated.
Producer Prices Section
With the V4 version of PricePedia a new section of data is available, relating to the production price surveys carried out by the central statistical institutes of the EU countries and collected by Eurostat. Producer prices relate to the prices of actual transactions carried out by companies operating in EU countries towards other companies of the same nationality or abroad. The classification used for the collection of producer prices is the NACE classification (relating to economic activities)[2]
Producer prices can be useful in two cases.
- for a review of how import prices have driven EU producer prices;
- to integrate customs information when it is highly dispersed.
Verification of the existing relationship between customs prices and producer prices
Customs prices, like all statistical surveys, may contain a margin of error. The methodologies developed by PricePedia[3] allow this margin to be reduced to a minimum.
From this point of view, producer prices can be a precious source, together with financial prices, to provide evidence of the robustness of customs prices. At the same time they can provide indications of how customs prices drive producer prices.
An example can be given by the comparison between the customs price indices relating to the aggregate of fertilizers and the related producer prices. The following graph shows this comparison.
Comparison between customs prices and producer prices of fertilizers
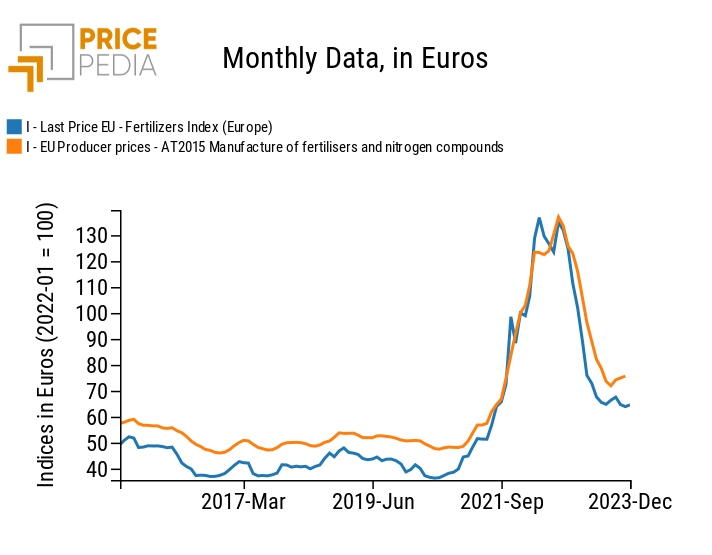
As can be seen, there is a strong alignment between the two price indices. Furthermore, the comparison between the two prices allows us to highlight how customs prices guided the dynamics of producer prices a few months in advance.
Integration of customs information
In some cases, the customs prices of a product may be missing. This happens in the case in which the forces on the EU market are not able to form a single price or, more frequently, in the case in which the customs code contains different products.
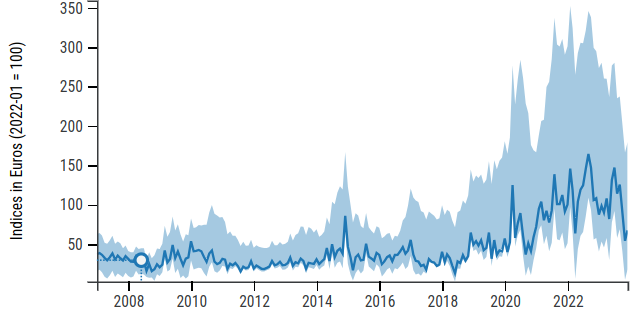
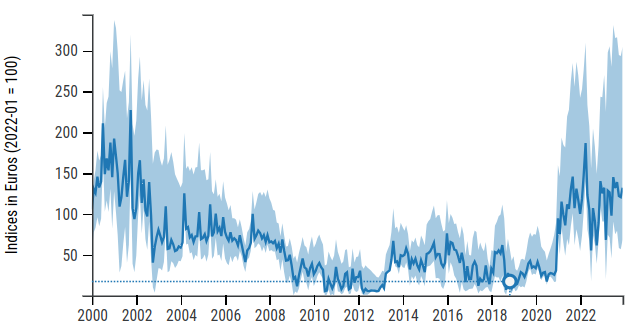
Perhaps the most representative case is that of electronic components. The customs codes of the available codes, such as processors (chips) or RAM memories, are very dispersed, as can be seen from the graphs shown here.
Dispersion of customs prices for electronic components
| Processors | RAM memories |
|---|---|
|
|
The signal of rising prices in the recent 2020-2023 cycle is clearly evident. But price dispersion is very high, due to the high variety of products contained in the different customs codes. The high dispersion makes it difficult to use these prices as reference benchmarks for the calculation, for example of the should cost of products that also have electronic components among their inputs. In this case it may be useful to use indices relating to producer prices, relating to very large components of products, but which are specifically constructed to extract dynamics signals that are as precise as possible. The following graph shows the producer price indices relating to electronic components and electronic boards.
Producer prices of electronic components and electronic boards
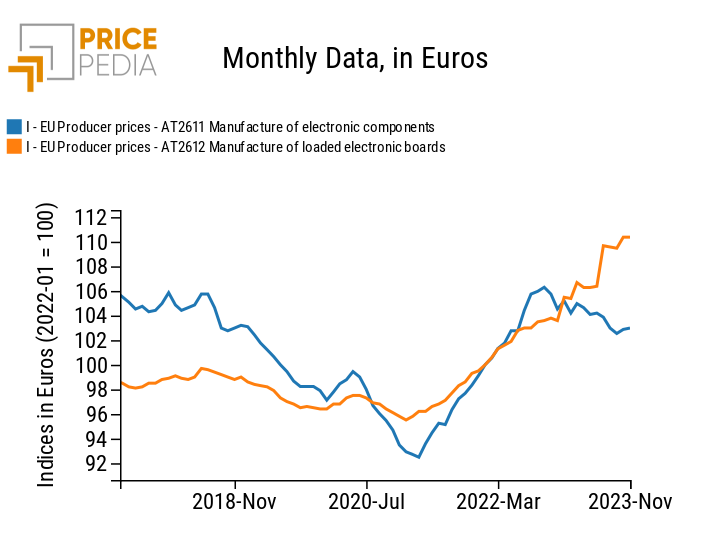
The signal of an increase in the prices of electronic components and cards has greater temporal continuity than the price that can be extracted from customs data. These goods recorded a decrease in prices until the end of 2020, and then began a phase of growth which, for electronic components, stopped in mid-2020, while it continued into 2023 for the prices of electronic boards.
[1] For a description of the difference between prices of futures contracts and prices of continuous contracts, see "Hot-rolled Coils USA: Future Continous".
[2] NACE is the acronym used by Eurostat to define the classification of economic activities (from the French Nomenclature statistique des Activités économiques dans la Communauté Européenne").
[3] There are three statistical tools used by PricePedia to minimize the margin of error present in customs prices: identification and replacement of outliers (anomalous values), estimation of missing data and exclusion of the tails of the data distribution for each temporal observation. Thanks to these techniques, the prices published by PricePedia represent a robust measure of the physical price of the various commodities, relating to the EU market.

