Preliminary analysis for the 2023 procurement budget
Before formulating the 2023 budget assumptions, it is appropriate to assess the degree to which the current price level is balanced
Published by Luigi Bidoia. .
Ferrous Metals Inorganic Chemicals Procurement Budget ForecastThe coming months will be complex for the Procurement function which will be subjected to two types of tensions: the first concerns ordinary management, aimed at guaranteeing production inputs at the best possible price; the second concerns the formulation of the 2023 purchasing budget.
The great uncertainty about the possible price level of raw materials and basic goods in the next year makes this second activity particularly complex. It suggests developing a dynamic budget, with periodic updates during 2023, to modify budget values based on information that will become available in the meantime.
A "dynamic" budget can be useful for pursuing many goals, but not all. The achievement of some objectives requires, in fact, budget values that are a reference point throughout the year. For example, this is the case of the role that the purchase budget has as a reference basis for the commercial function that is called upon to define pricing policies. From this point of view, a fundamental decision for the company is to evaluate whether the possible reduction in purchase prices will be able to bring the income statement back into balance, avoiding having to plan (and communicate) future price increases, or whether However, purchase prices will remain high enough to require extraordinary price increases. To support this decision, given the high uncertainty, it is difficult to hypothesize a precise forecast that does not change according to upcoming events. Alternatively, a measure of the probability that the price of a given input could undergo a significant contraction, for example by more than 20%, may be useful. If this probability is high, then it will be appropriate to take into account its effects on the possible rebalancing between prices and business costs. Conversely, if this probability is low, the September / October market price level[1] can be considered a good basis for supporting pricing policy decisions in 2023.
To give practical relevance to this consideration, we have therefore analyzed the over 500 prices monitored in PricePedia to assess which of these have a high probability of undergoing a strong reduction in the coming months. We have identified a list of possible prices, considering the ones they have recorded:
- significant growth between the 2003 average and August 2008, the month before Lehman Brothers' bankruptcy on 15 September 2008 and the resulting global crisis;
- price levels in 2011 significantly lower than those of August 2008, indicating that the prices of August 2008 involved extra profits for these products, which were subsequently eliminated from the market;
- high growth between 2019 and July / August 2022.
The following table shows the list of prices with these characteristics.
| Prices with high probability of significant decreases in the coming months | ||||
| Segment | Product | Var% 2003-Aug2008 | Var% Aug2008-2011 | Var% 2019-Jul2022 |
| Chemistry for Industry | Urea | 124.8 | -24.4 | 176.1 |
| Inorganic Chemicals | Sulfur | 465.4 | -52.1 | 184.8 |
| Inorganic Chemicals | Cobalt oxides and hydroxides | 119.8 | -49.3 | 92.9 |
| Inorganic Chemicals | Phosphoric acid and polyphosphoric acids | 154.1 | -24.4 | 84.2 |
| Inorganic Chemicals | Potassium chloride | 248.4 | -35.5 | 134.6 |
| Inorganic Chemicals | Potassium nitrate | 149.9 | -22.2 | 72.6 |
| Inorganic Chemicals | Sodium triphosphate | 106.2 | -23.7 | 79.3 |
| Inorganic Chemicals | Diammonium phosphate | 221.1 | -33.1 | 184.1 |
| Inorganic Chemicals | Dicalcium phosphate | 196.0 | -37.6 | 59.5 |
| Inorganic Chemicals | Calcium phosphates | 257.9 | -48.1 | 163.4 |
| Inorganic Chemicals | Ammonium sulfate | 198.8 | -34.6 | 160.7 |
| Inorganic Chemicals | Sulfuric acid | 144.8 | -30.9 | 113.8 |
| Inorganic Chemicals | Phosphorus trichloride | 75.9 | -42.8 | 61.7 |
| Organic Chemicals | Glycerol | 60.6 | -40.9 | 128.1 |
| Ferrous | H-profiles | 84.4 | -32.0 | 111.5 |
| Ferrous | Steel chips | 141.2 | -27.6 | 62.3 |
| Ferrous | Scrap steel | 134.1 | -27.2 | 55.7 |
| Ferrous | Bars, rectangular section | 92.6 | -27.2 | 116.3 |
| Ferrous | Magnetic Plate - Directed Grains (width> = 600mm) | 59.6 | -42.1 | 115.1 |
| Ferrous | Crude iron in ingots (Mn> = 0,4%) | 111.9 | -27.6 | 112.0 |
| Ferrous | Ferro-manganese (C <= 2%) | 130.9 | -41.7 | 103.7 |
| Ferrous | Ferro-chrome | 165.1 | -42.7 | 64.1 |
| Ferrous | Magnetic Plate - Directed Grains (width< 600mm) | 92.3 | -35.6 | 72.8 |
| Ferrous | Steel rods | 107.7 | -32.0 | 89.9 |
| Ferrous | Rebar steel | 122.3 | -40.4 | 95.8 |
| Ferrous | Steel beams 80-220 mm | 88.6 | -28.2 | 115.9 |
| Non Ferrous | Cobalt mattes | 100 | -49.6 | 85.8 |
| Non Ferrous | Unwrought magnesium (weight => 99.8%) | 110.7 | -30.2 | 164.9 |
| Non Ferrous | Unwrought magnesium (weight => 90% and <= 99.7% | 81.3 | -25.9 | 86.5 |
Do you want to stay up-to-date on commodity Market trends?
PricePedia Newsletter: sign up!
An analysis by price segments
The list of products in the table is particularly significant due to the characteristics of the families with the greatest presence.
The most present family, with a 40% share, is Inorganic Chemicals. The products of this family they are therefore characterized by markets in which strong accelerations in demand (often supported by accumulations of retorts) can lead to strong price increases. However, the supply in these markets is relatively little concentrated.
This leads to a fall in prices via competition mechanisms, as soon as the change in demand takes on an opposite sign, driven by the reduction of previously accumulated stocks.
Another highly represented family is that of the Ferrous, also in this case with over 40% of cases. If you analyze the products belonging to this family, you will encounter many products intended for construction (rods and reinforcing bars and beams), showing how the market can be strongly influenced by the cyclical nature of the construction sector. Still in the Ferrosi family, we find scrap, characterized by a market with a little concentrated supply and a highly elastic demand to the price.
The remaining products are distributed among the various families, with very low numbers, therefore unable to characterize them.
The typical evolution of prices
The products identified through these parameters are characterized by a price dynamics that has a marked "hump" in 2008 and an accentuated growth in 2021. The graph below shows the price index of four products which clearly shows the strong similarity of the curve of the different prices.
PricePedia Last-Price Indices

These prices signal markets whose functioning, in the presence of sustained and concentrated increases in demand over time, generates very high increases in prices, far greater to the evolution of costs. The new price level, however, is not incorporated by the market and, as demand returns to normal , prices tend to fall significantly, returning to levels similar to those existing at the beginning of the cycle.
In the context of this analysis, the collapse accused by the price in 2009 is not significant, given the general situation of severe economic crisis that characterized that year. The price level of 2011 is much more indicative, when the world economy returned to growth, recovering the pre-crisis levels of demand for raw materials. For the products considered, the average price of 2011 is decidedly lower than the maximum level of August 2008, signaling the presence of forces which prevented a return to a situation of prices not aligned with costs.
Conditions outside the market
All things being equal, the product markets listed in the table above are governed by mechanisms which, in the face of the current slowdown in world demand for raw materials, should quickly bring prices back to the levels of 2019, the last year that may be considered normal.
However, conditions may have changed significantly between the end of the first decade of this century and the beginning of the twenty-year period. The two likely areas of change are:
- the concentration of supply: if this is now more concentrated, supply may be able to reduce production levels in line with the reductions in demand, sustaining prices closer to the levels reached this summer;
- the dynamics and levels of production costs: if the costs, in the two periods considered, are very different, then the higher current costs could prove to be a factor supporting prices, preventing a significant reduction.
Conclusions
It is evident that the concentration of supply and the dynamics of production costs are conditions that specifically characterize each market. For each price, an in-depth analysis should therefore be made to verify whether the concentration of supply and the level of costs have changed significantly compared to 2008. For example, on the cost side, certainly the electric steel industry currently has costs much higher than the prevailing ones. ten years ago. This, of course, will tend to limit the decline in the prices of those ferrous products that are mainly produced with electric furnaces.
With some exceptions, however, it is very likely that autumn / winter will see a sharp decline in the prices of many products, compared to the anomalous levels of this summer, suggesting that this eventuality should also be considered in the definition of the 2023 budget.
[1] It seems useful to point out that an evaluation of the actual market prices may not be immediate, due to the much "noise" that characterizes the different markets. In this case, the last price customs may be the most appropriate measure, because it is objective (derived from actual transactions), robust (obtained as the average of many transactions) and up-to-date (relating to transactions based on contracts of the last month).
You may be interested in:
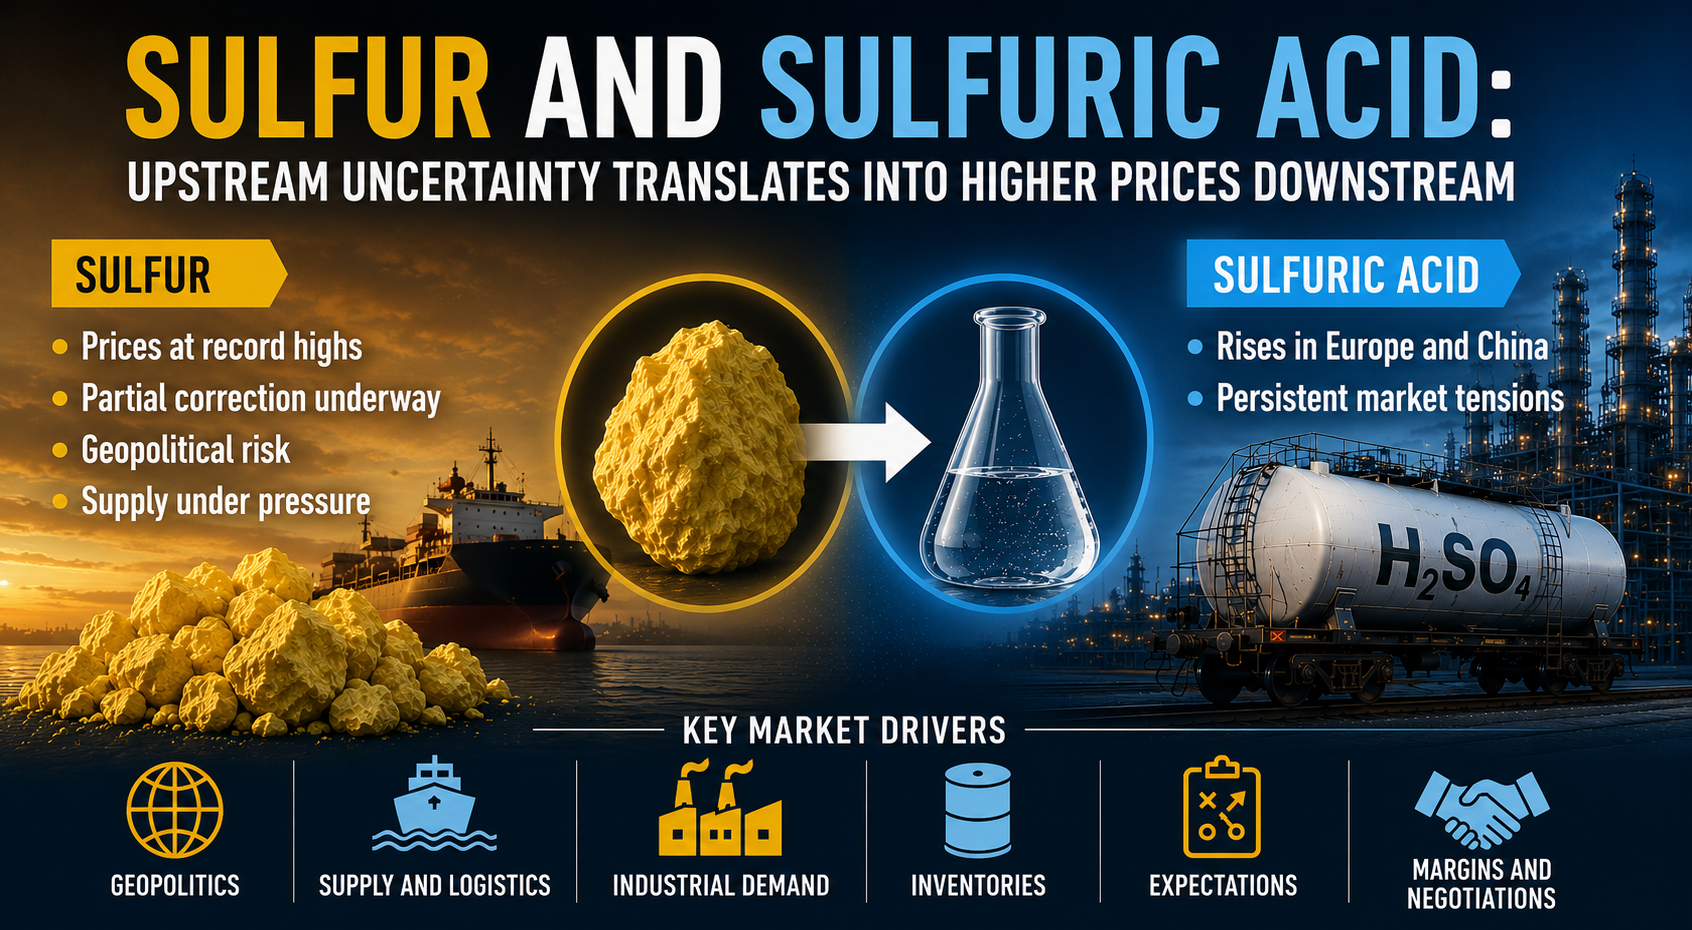
Sulfuric Acid: Sulfur Sets the Price
Published by Daniel Vito Lobasso. .
Inorganic Chemicals Strait of HormuzIl ribasso dei prezzi OTC cinesi dello zolfo dopo il parziale sblocco dello Stretto di Hormuz segnala un alleggerimento del premio geopolitico [ Read all ]
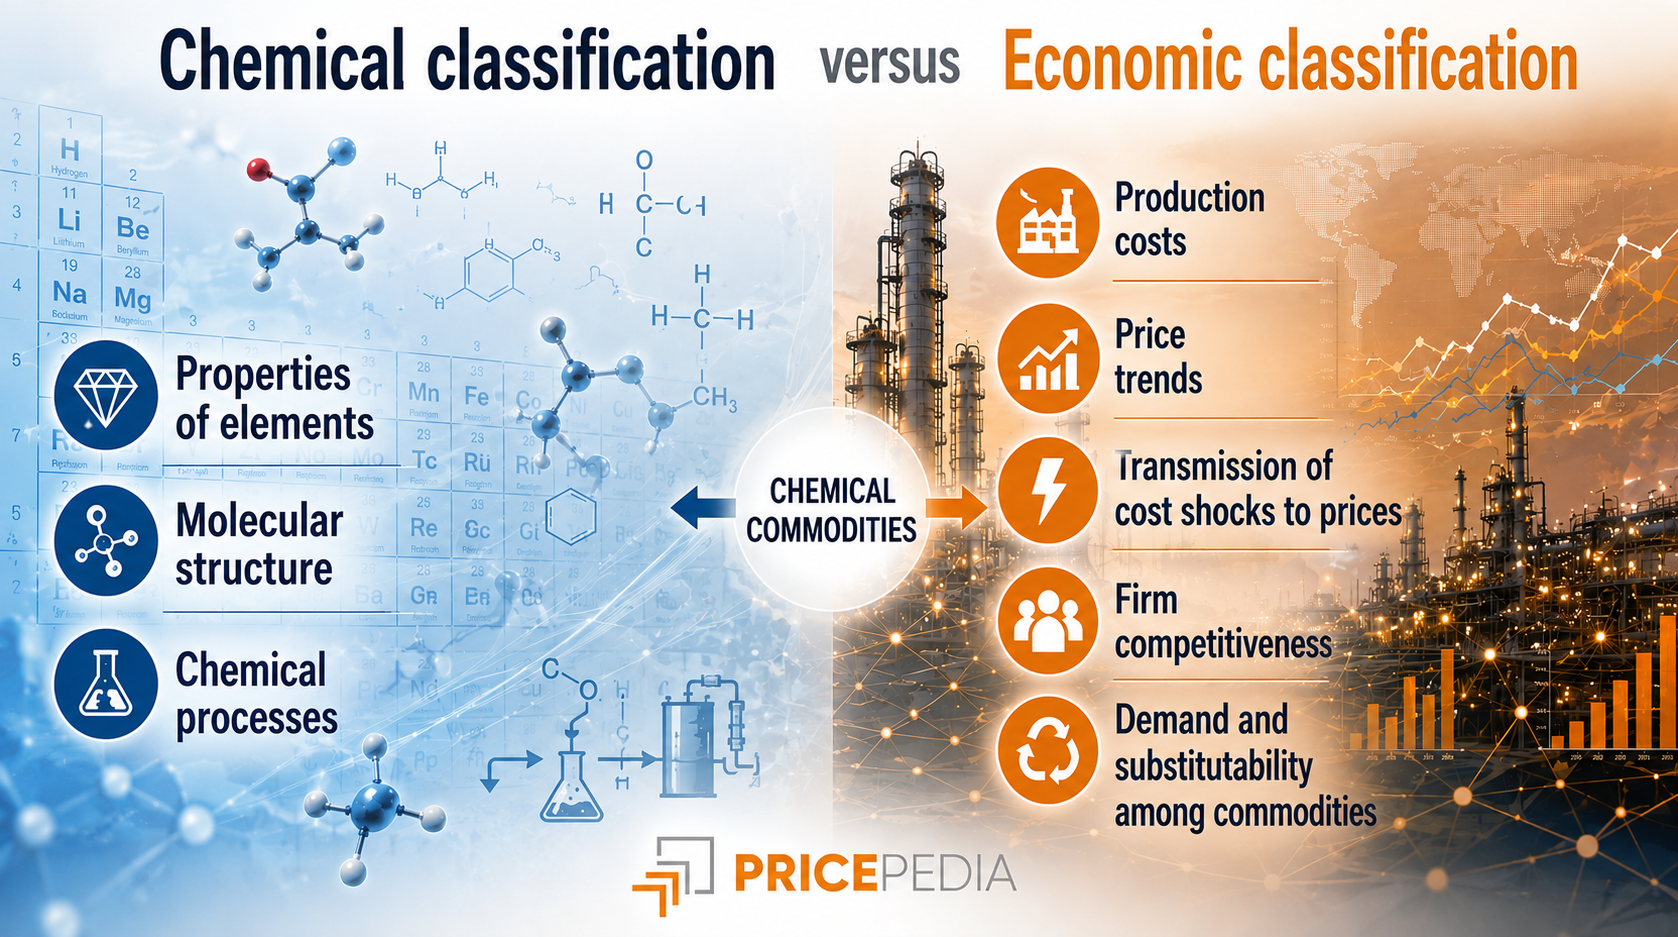
An Economic Classification of the Chemical Industry
Published by Daniel Vito Lobasso. .
Organic Chemicals Specialty chemicals Inorganic Chemicals Petrolchimica Analysis tools and methodologiesLa mappa per l’analisi dei prezzi: dalle relazioni chimiche alle relazioni economiche [ Read all ]
Iron ore price forecast for 2026 - 2027
Published by Luca Sazzini. .
Ferrous Metals Forecast ForecastWhat are analysts' forecasts for iron ore prices? [ Read all ]