China Economic Update September 2025
Chinese customs prices continue to decline
Published by Luca Sazzini. .
Conjunctural Indicators Global Economic Trends The monthly update of Chinese commodity prices on PricePedia for September 2025 has been published.
In aggregate terms, Chinese commodity export prices in dollars continued to decline, recording a month-on-month change of -0.34%. When converted into euros, this reduction amounts to -1.2%.
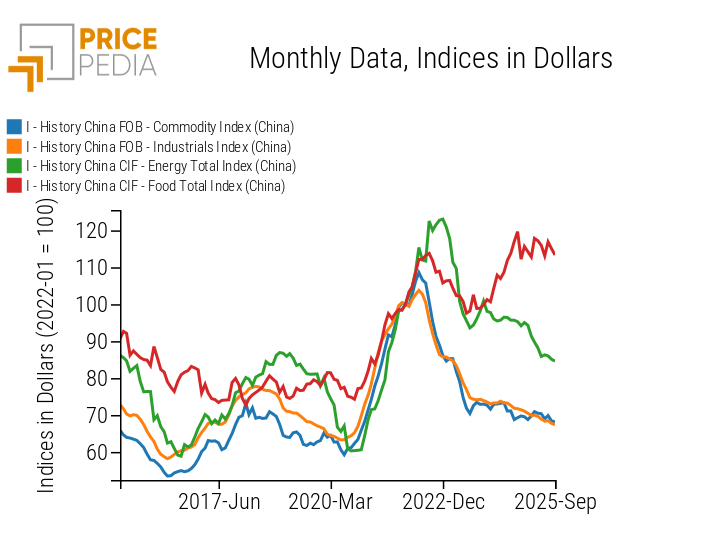
The chart below shows the evolution in dollar terms of the main aggregated indices of Chinese commodities available on PricePedia: Commodity Index[1], Industrials[2], Energy, and Food, with levels indexed to 100 as of January 2022.
For aggregates in which China is primarily a net importer, such as energy and food, the indices of import prices in dollars (CIF) are reported. Conversely, for the industrials aggregate and for the Commodity Index, export prices in dollars (FOB) are reported.

The CIF price indices for energy and food logically follow the dynamics of the corresponding international prices. In September, both recorded negative changes of -1.49% and -0.58%, respectively. Within the food category, some prices fell much more sharply: average dollar prices for non-virgin olive oil, cocoa beans, and rapeseed seeds decreased by about -8%, -7%, and -4% compared to August.
The decline in Chinese import energy prices is mainly due to the drop in LNG CIF, which fell -7% month-on-month, and low-sulfur petroleum coke, down -5% m/m. Crude oil prices, instead, remained relatively stable, recording a minimal change of 0.12%.
Regarding the industrial commodities aggregate, export prices in dollars fell by -0.55% month-on-month, continuing the downward trend initiated in June 2022. The sharpest contraction affected plastics and elastomers, whose export prices in dollars declined by nearly -2% compared to August, in line with the trends of Chinese financial markets.
Analysis of Industrial Commodities by Category
Beyond the dynamics of September alone, it is useful to analyze year-on-year changes of the different FOB price categories for Chinese exports.
The table below shows the year-on-year changes in September 2025, compared to September 2024, of Chinese export prices in dollars for the categories included in the industrial commodities aggregate.
Year/year variations in Chinese customs prices in $/ton
| 2025-05 | 2025-06 | 2025-07 | 2025-08 | 2025-09 | |
|---|---|---|---|---|---|
| I-China FOB Historical – Ferrous Commodity Index (China) | −13.61 | −12.65 | −11.76 | −12.66 | −10.91 |
| I-China FOB Historical – Non-Ferrous Commodity Index (China) | −0.77 | −1.48 | −0.51 | +1.91 | +4.59 |
| I-China FOB Historical – Plastics & Elastomers Commodity Index (China) | −5.54 | −5.40 | −6.50 | −7.56 | −9.57 |
| I-China FOB Historical – Organic Chemicals Commodity Index (China) | −8.75 | −10.05 | −11.91 | −14.00 | −15.13 |
| I-China FOB Historical – Inorganic Chemicals Commodity Index (China) | −2.55 | −3.50 | −2.55 | −2.85 | −4.14 |
| I-China FOB Historical – Specialty Chemicals Commodity Index (China) | +0.55 | −1.89 | +1.41 | −0.32 | +0.72 |
| I-China FOB Historical – Textile Fibers Commodity Index (China) | −8.97 | −9.39 | −10.01 | −9.43 | −8.96 |
Over the past 12 months, there has been a general decline in Chinese export prices, except for Specialty Chemicals, which remained stable at last summer’s levels, and for Non-Ferrous Metals, which rose nearly 5% compared to September 2024.
The steepest decline occurred in Organic Chemicals, down -15% over the past year. Among organic chemicals, aniline, methacrylic acid, and lysine prices fell by more than -30% in dollar terms. The second-largest contraction was in Ferrous Metals, down nearly -11%. Within this sector, the largest drop was observed for N.G.O. magnetic steel sheets ≥ 600 mm, whose FOB prices decreased over 20% year-on-year.
The annual increase in Non-Ferrous Metals export prices was driven by rising prices for cobalt metal, aluminum sheets, and crude manganese. The largest increase concerned cobalt metal, which rose over 20% compared to September last year, following the suspension of exports by the Democratic Republic of Congo, which in 2024 supplied about 75% of the world’s output.[3]
It is worth noting that the reduction in Chinese export prices is particularly marked in three sectors where China holds a global leadership position: organic chemicals, ferrous metals, and plastics & elastomers. This trend appears linked to the slow growth of Chinese industry, weak domestic demand for raw materials, and the consequent efforts of Chinese producers to find new foreign markets. Chinese commodity supply continues, therefore, to play a significant role globally in keeping prices for these goods contained.
1. The PricePedia Commodity Index results from the aggregation of industrial, food, and energy commodity indices.
2. The PricePedia Industrial Price Index results from the aggregation of indices for the following categories: Ferrous, Non-Ferrous, Wood & Paper, Pharmaceutical Chemicals, Specialty Chemicals, Organic Chemicals, Inorganic Chemicals, Plastics & Elastomers, and Textile Fibers.
3. For further details on cobalt price dynamics, see the article: Cobalt price forecasts


