Financial markets once again at Trump's mercy
Disappointing employment data, tariffs, threats to the Fed, and layoffs: a nightmare Friday on Wall Street
Published by Luca Sazzini. .
Conjunctural Indicators Commodities Financial WeekThe week just ended saw a sharp acceleration in market turbulence. After a few relatively stable days, financial markets were once again shaken on Friday by statements from President Trump. The trigger was the release of disappointing U.S. employment data, to which Trump contributed with a series of decisions that amplified the instability:
- a new attack on the Federal Reserve, threatening to remove Powell unless interest rates are cut;
- the imposition of drastic tariffs against dozens of countries (including Canada, the EU, Taiwan, Switzerland, India, South Africa), with immediate effects on global markets;
- the dismissal of Bureau of Labor Statistics director Erika McEntarfer, accused of releasing negative employment data;
- the repositioning of U.S. nuclear submarines as a signal to Russia, fueling geopolitical tensions.
On Friday alone, Brent oil prices collapsed by 4%, the S&P 500 index fell by 1.6%, while the dollar depreciated by nearly 2% against major currencies.
The week had begun in a climate of near optimism, supported by recent developments in trade relations. The new tariff agreement between the United States and the European Union generated bullish momentum in energy markets, particularly oil and natural gas. The deal includes a 15% U.S. tariff on European imports—lower than the initially proposed 30%—in exchange for the removal of all European tariff barriers toward the United States.
In addition to the tariff revision, the agreement includes side commitments: the EU pledged to purchase up to $750 billion in U.S. energy (natural gas, oil, and nuclear technologies) and to invest $600 billion in the U.S. in strategic defense and technology innovation sectors.
The 50% tariffs on European aluminum and steel remain in effect, while negotiations are underway for the future introduction of preferential quotas. Simultaneously, some U.S. tariffs on strategic European imports—such as aircraft, semiconductors, critical raw materials, and specific chemical and food products—have been lifted.
The reduction in U.S. tariffs on European imports from 30% to 15%, along with the EU's commitment to purchase $750 billion in U.S. energy, fueled speculation in oil and natural gas prices.
Oil prices were further supported by the decision to shorten the deadline for Russia to reach an agreement with Ukraine to end the conflict from 50 to just 10 days. Otherwise, the U.S. will implement reinforced sanctions, including secondary tariffs up to 100% against countries continuing to import Russian oil. The prospect of such measures pushed oil prices up nearly 4% on Tuesday alone. However, the market remains skeptical about the actual enforcement of these threats, considering Trump has repeatedly expressed a desire to lower crude oil prices.
In this context, the news and measures announced on Friday reversed expectations, leading to a 4% drop in both Brent oil and Dutch TTF-traded gas prices.
Adding to these macroeconomic effects was Thursday’s collapse in the price of copper listed on the Chicago Mercantile Exchange (CME). Contrary to the announcement made on July 8, the Trump administration stated that copper will not be subject to 50% tariffs starting August 1. The relevant executive order clarifies that such tariffs will apply only to copper-derived products, excluding ores, cathodes, and scrap.
Tariffs on copper cathodes will be applied at a reduced 15% rate starting only in 2027, then rising to 30% in 2028. This gradual approach aims to give the U.S. industry time to adapt, considering that about half of U.S. copper demand is met by foreign supply.
The announcement caused a 22% drop in copper prices on the CME, with a loss of nearly $2,700 per ton in a single session, bringing prices back in line with those on the London Metal Exchange (LME).
The following chart shows the evolution of copper prices at the CME and LME, expressed in dollars per ton.
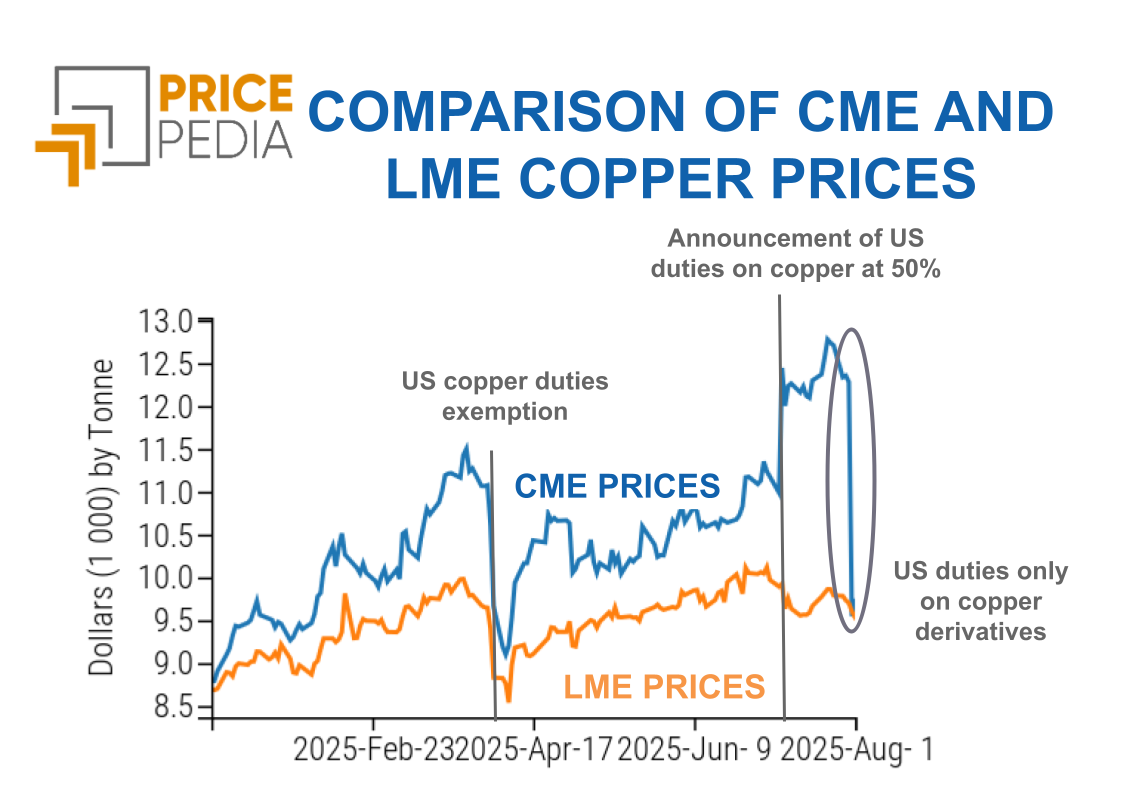
At the beginning of the year, copper prices were aligned, but fears over the introduction of U.S. tariffs on imports gradually pushed CME prices above those on the LME, marking the start of a regionalized market.
These concerns partially eased in April when copper was added to Annex II, officially excluding it from tariffed product categories and favoring a convergence in prices between the two financial markets. However, tensions resumed until July 8, when President Trump announced the introduction of 50% tariffs on copper starting August 1, causing an immediate spike in prices. On July 30, it was clarified that such tariffs would apply only to copper-derived products, leading to the elimination of the CME-LME price spread.
The ferrous metals market, unlike non-ferrous metals, remained generally stable during the week, with daily fluctuations in opposite directions balancing each other out. In particular, the upward trend in the prices of Chinese iron ores continued, following China’s announcement of the construction of the world’s largest hydroelectric dam in Tibet.
In the food sector, oil prices remained stable, tropical products showed mixed trends, while cereals declined, influenced by the prospect of increased exports from Argentina, where the government announced a reduction in export tariffs.
Federal Reserve Monetary Policy
Despite political pressure from President Donald Trump, the Federal Reserve (Fed) once again decided to keep interest rates unchanged, confirming the range between 4.25% and 4.50%. Fed Chairman Jerome Powell reiterated the need to closely monitor inflation and labor market developments before adopting new measures. Two governors dissented, proposing a rate cut, but the committee’s majority deemed a “moderately restrictive” monetary policy appropriate to prevent a possible resurgence of inflationary pressures, also considering the U.S.’s protectionist trade policy.
Currently, economic data indicates moderate growth, reducing the urgency to preemptively cut rates.
NUMERICAL APPENDIX
ENERGY
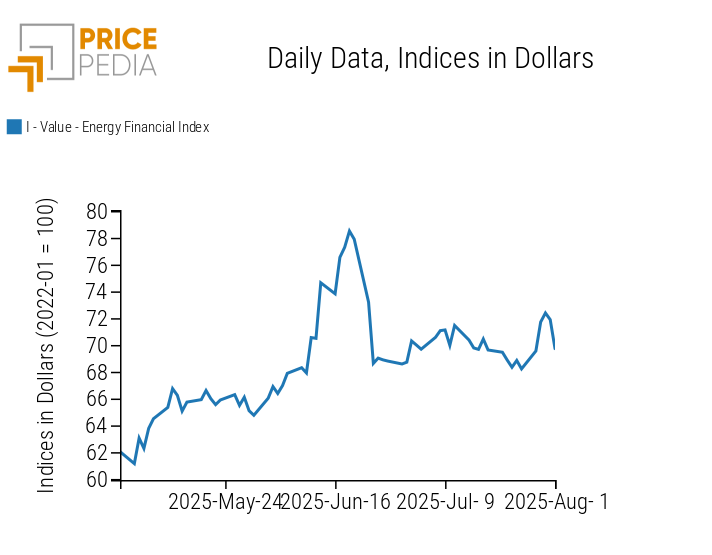
The PricePedia financial index of energy products followed a bullish trend through Thursday, supported by Europe’s commitments to increase purchases of U.S. energy goods and Trump’s threats of new sanctions on Russian oil, should no peace agreement be reached in Ukraine within ten days. This trend completely reversed on Friday.
PricePedia Financial Index of energy prices in USD
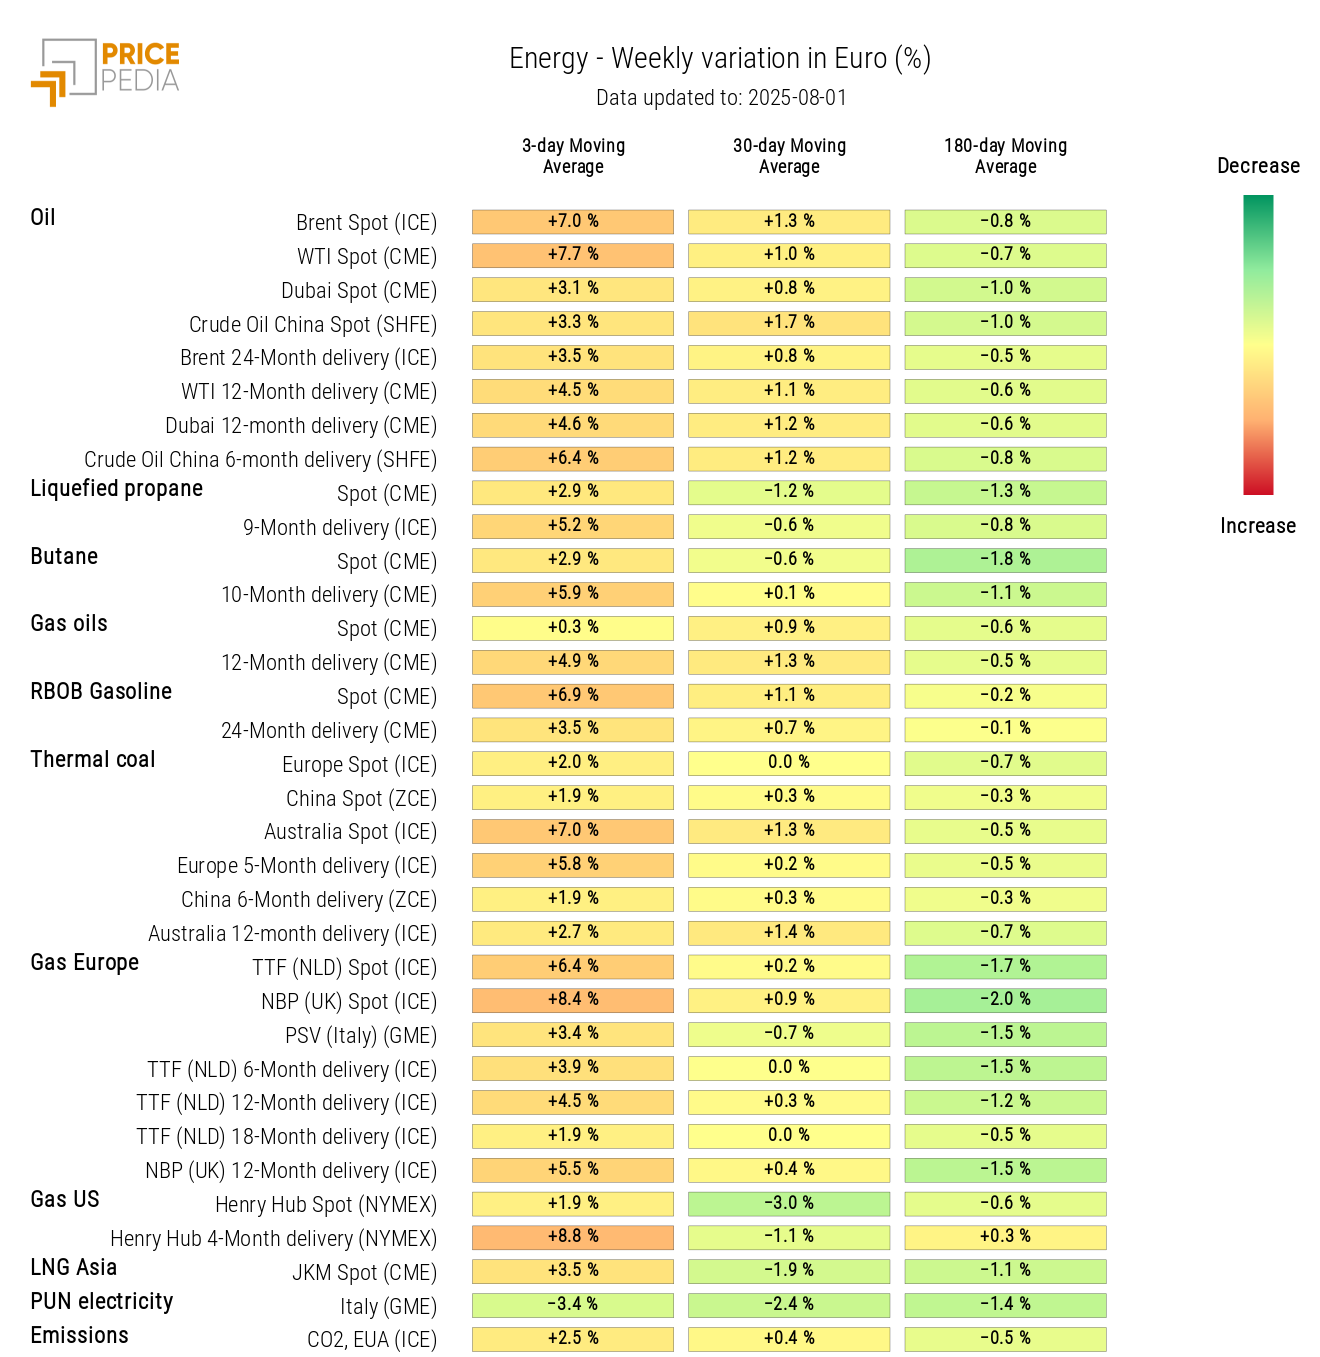
Due to the euro’s depreciation at the start of the week, the energy price heatmap in euros shows mostly red, indicating a widespread increase, particularly in oil and European natural gas quoted at the Dutch TTF. However, the three-day average data at the end of the week softens the impact of Friday’s collapse, limiting its visible effect on the heatmap.
HeatMap of energy prices in euros
PLASTICS
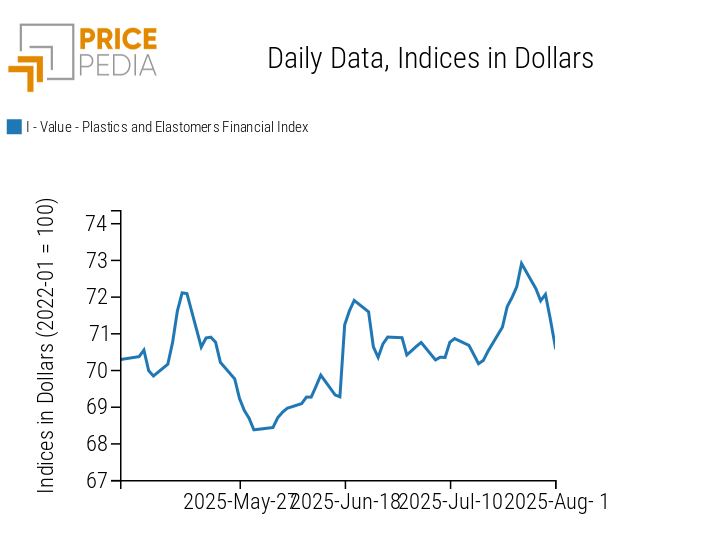
The Chinese financial index of plastics and elastomers halts its growth phase, recording a significant drop in price levels.
PricePedia Financial Indices of plastic prices in USD
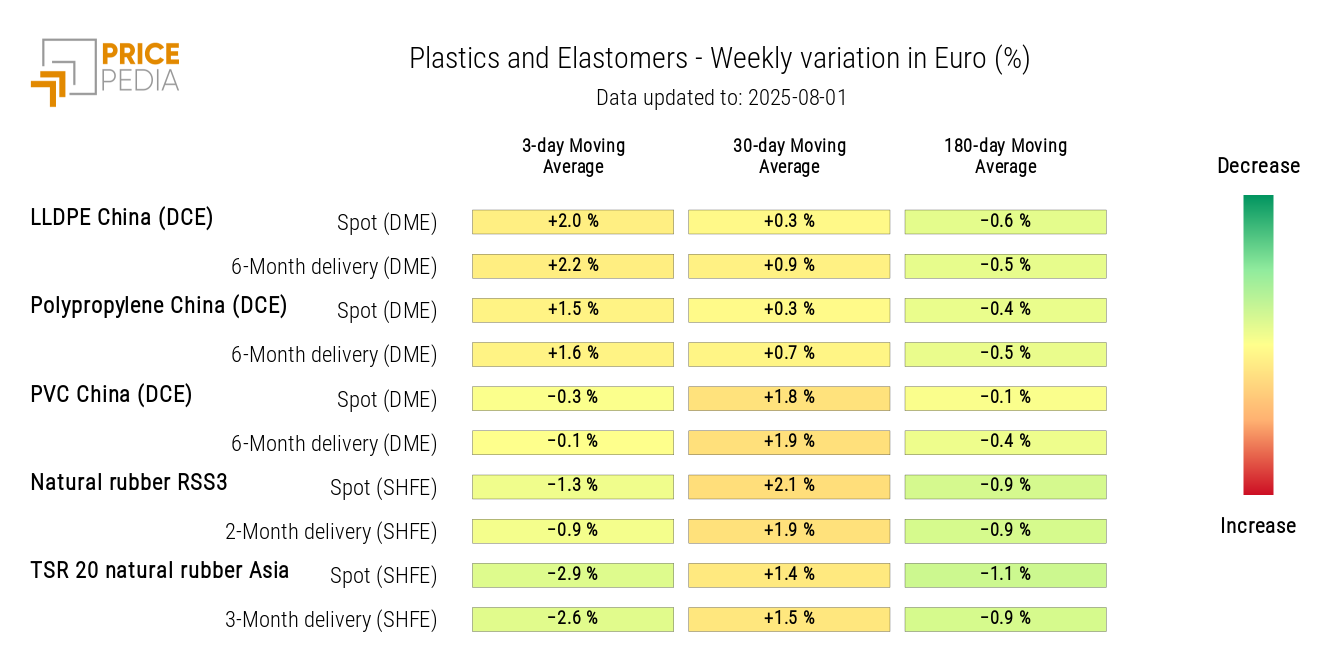
The heatmap analysis shows a decline in natural rubber and PVC prices, offset by a slight increase in LLDPE and propylene prices.
HeatMap of plastics and elastomers prices in euros
FERROUS
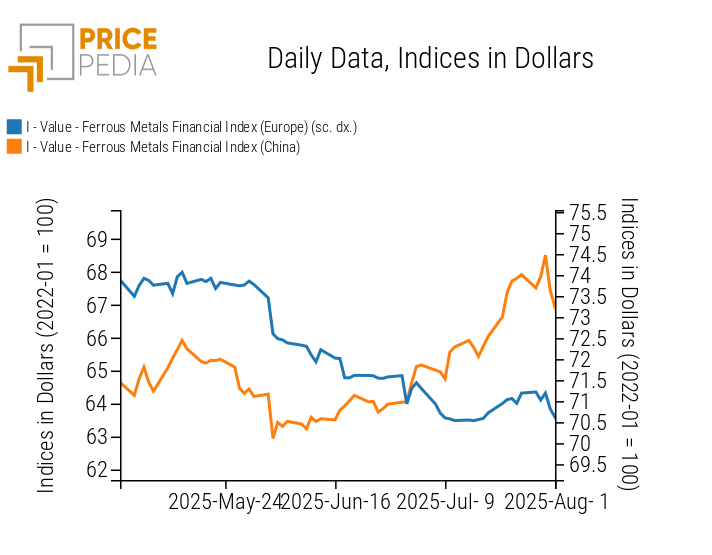
Ferrous metal indices also ended the week with a sharp drop, after a series of daily swings in opposite directions recorded in the early part of the week.
PricePedia Financial Indices of ferrous metal prices in USD
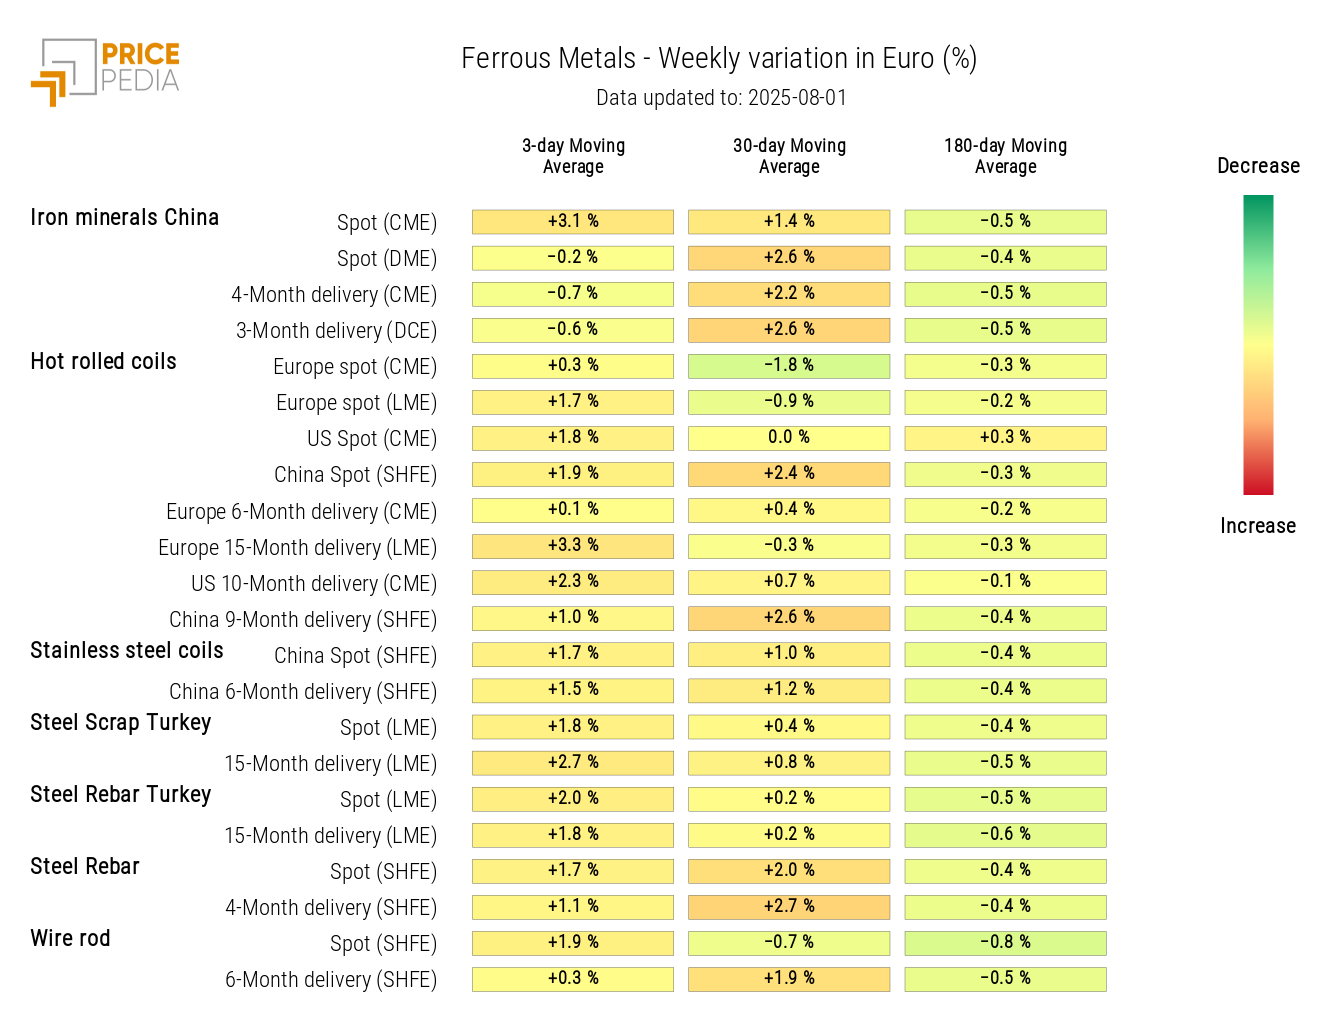
Due to the euro’s depreciation at the beginning of the week and in the three-day moving average, the heatmap of ferrous metal prices in euros highlights especially the increase in prices of iron ore and hot-rolled coils that occurred in the first part of the week.
HeatMap of ferrous metal prices in euros
Do you want to stay up-to-date on commodity market trends?
Sign up for PricePedia newsletter: it's free!
INDUSTRIAL NON-FERROUS METALS
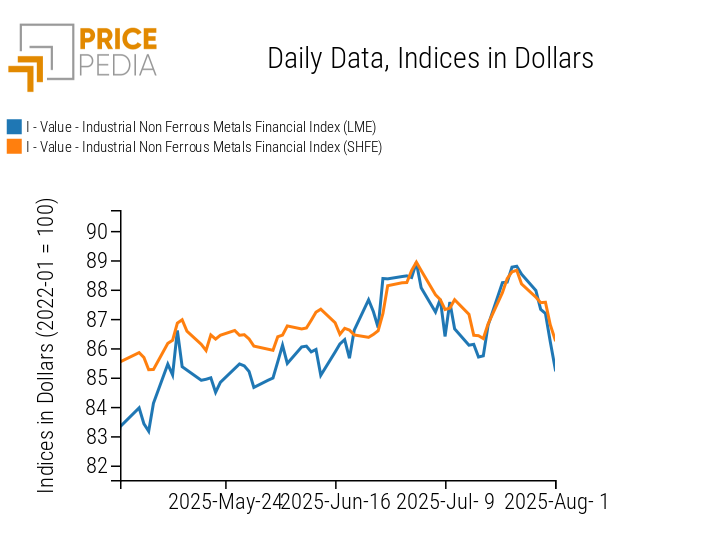
Both indices of non-ferrous metals show a clear downward trend during the week, with an acceleration on Friday.
PricePedia Financial Indices of industrial non-ferrous metal prices in USD
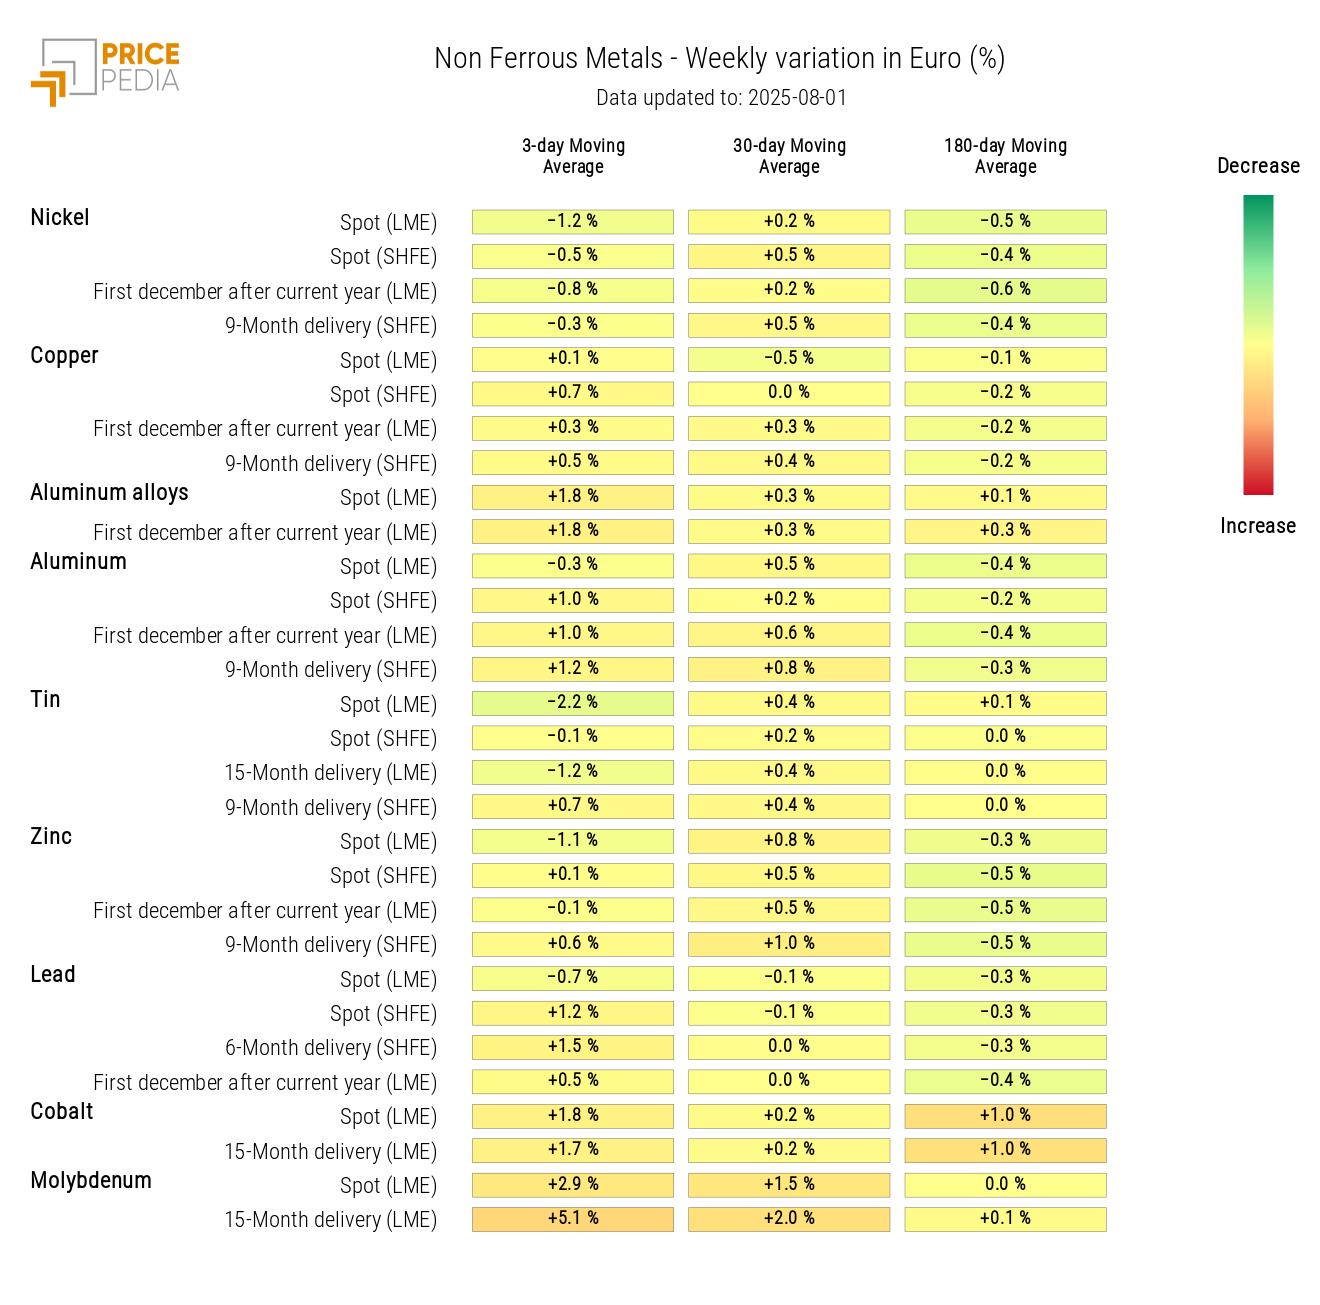
From the heatmap analysis, a weekly decrease is observed in the 3-day moving average of tin and an increase in that of molybdenum.
HeatMap of non-ferrous metal prices in euros
FOOD
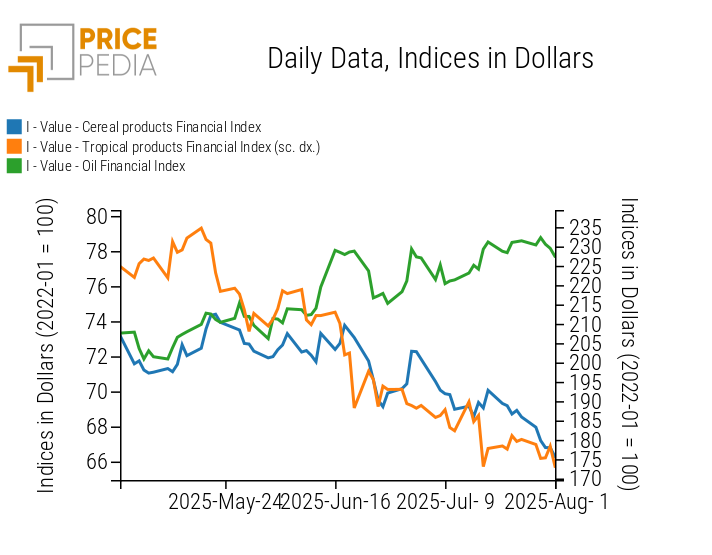
Analysis of the three food indices reveals three distinct dynamics: edible oil prices show a lateral trend, tropical product prices diverge, while cereal prices are declining. All three indices saw a significant drop on Friday.
PricePedia Financial Indices of food prices in USD
CEREALS
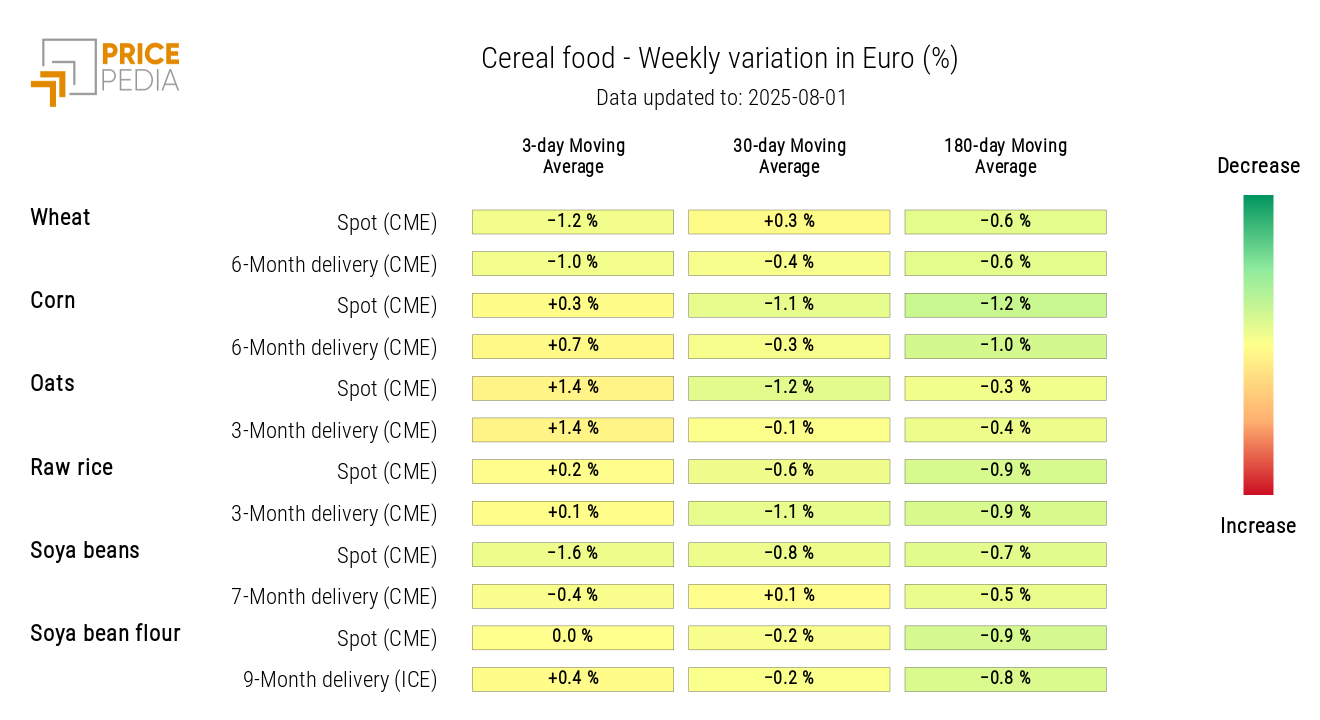
The cereal price heatmap shows a decline, particularly for soybeans, consistent with expectations of increased Argentine exports. The Argentine government announced a reduction in export tariffs from 33% to 26%.
HeatMap of cereal prices in euros
TROPICALS
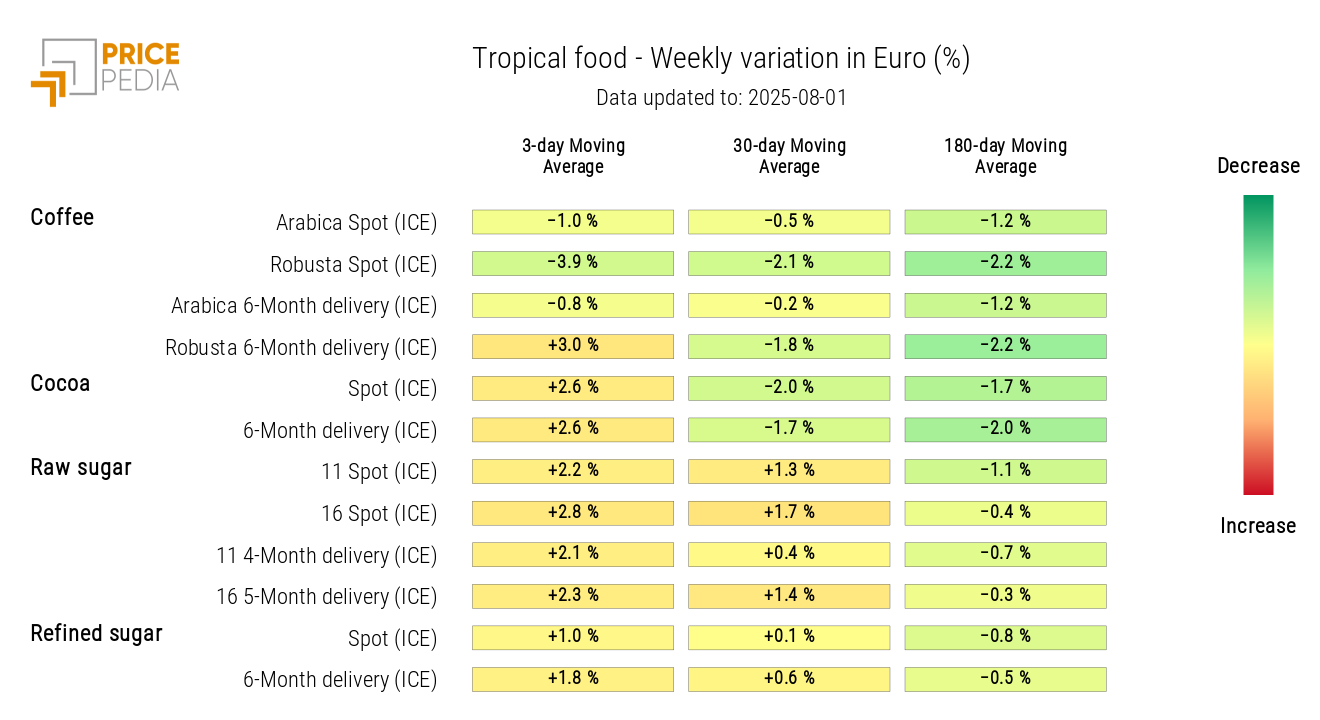
The tropical heatmap shows a weekly increase in the 3-day moving average of cocoa and sugar prices.
HeatMap of tropical food prices in euros
OILS
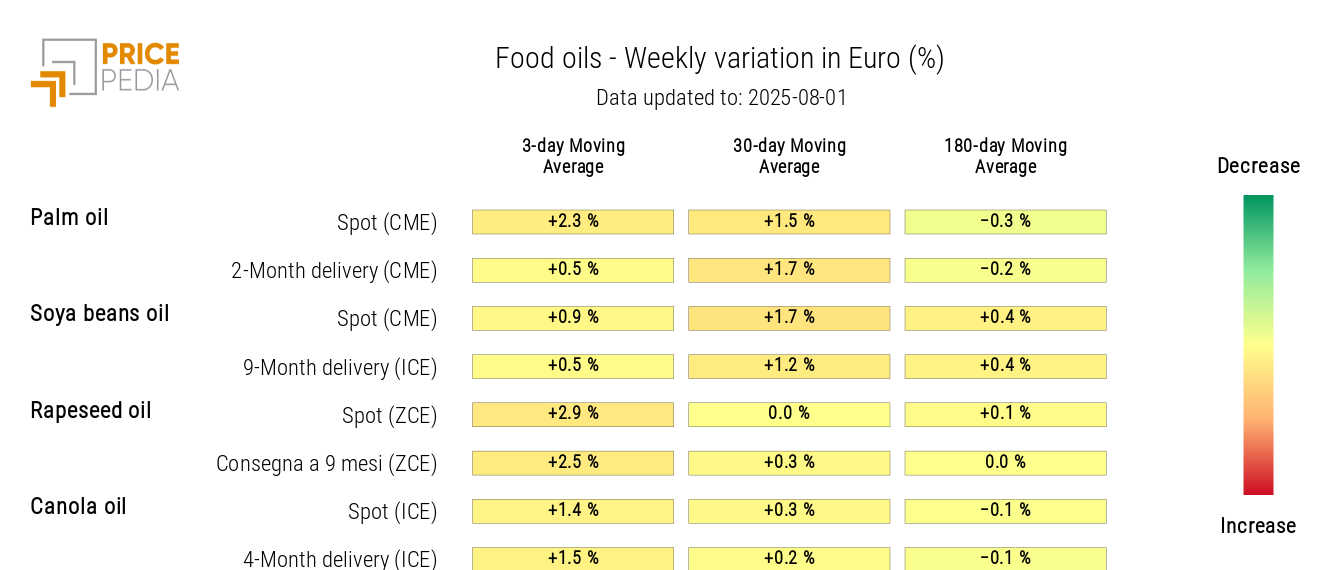
The edible oils heatmap shows a general increase in prices in euros, supported by the depreciation of the European currency at the beginning of the week.
HeatMap of edible oil prices in euros
