Optimism in Chinese markets fueled by favorable news
Despite fears of a slowdown in global trade, China surprises by continuing on its growth path.
Published by Luigi Bidoia. .
Conjunctural Indicators Commodities Financial WeekIn July, under the threat of tariffs announced on Liberation Day, significant steps were taken towards a new global order outlined by the American administration. One possible outcome of the many ongoing negotiations could be the imposition of general 15% tariffs on U.S. imports from major trading partners (Japan, the EU, China), with increasing rates for other countries: from 19% for Indonesia and the Philippines up to 50% for Brazil. However, it is very difficult to assess the actual probability of this scenario, given the unpredictability of Trump and his administration.
Financial markets appear to be considering this scenario, but with great caution, ready to quickly revise their positions based on the interpretation of the President’s statements: mere negotiating tactics or a clear announcement of future goals? The world’s major stock markets, led by the United States, are currently at all-time highs.
Commodity markets also seem to be pricing in a phase of adjustment to the new order of global trade. For the fourth consecutive week, energy prices have remained largely stable: Brent crude hovers around $70 per barrel, while gas prices at the Dutch TTF trading hub remain near €34/MWh.
However, economists' assessments point to a high likelihood of a slowdown in global trade and economic growth in the coming months, leading to weaker global demand for commodities and downward pressure on their prices.
In contrast to this scenario, the Chinese economy appears able to maintain a path of sustained growth. In the first half of 2025, China’s GDP grew by 5.3% year-on-year, and notably, overall exports increased despite a sharp contraction in those directed to the United States. The Chinese economy is therefore proving resilient in the face of the new world economic order promoted by Washington, designed precisely to curb its expansion. Domestic confidence has further increased following the announcement of a 1.2 trillion CNY hydroelectric project, aimed at stimulating demand for construction materials such as steel and cement. If completed, the project would become the largest hydroelectric plant in the world, with an estimated output capacity of 300 billion kWh per year, three times that of the Three Gorges Dam.
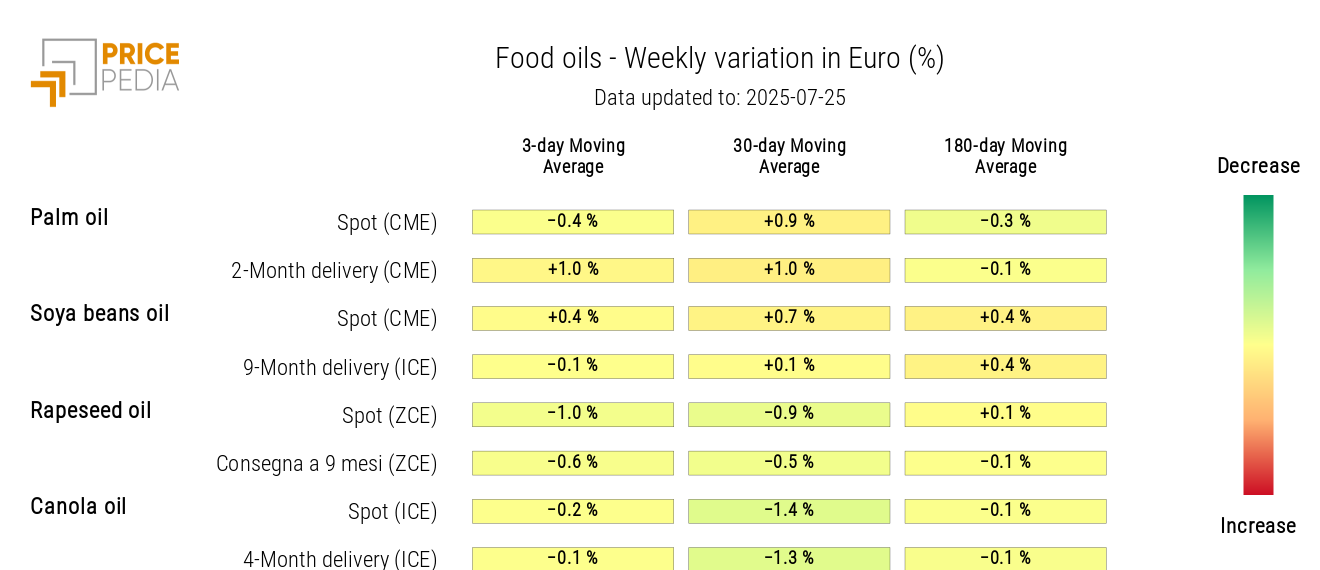
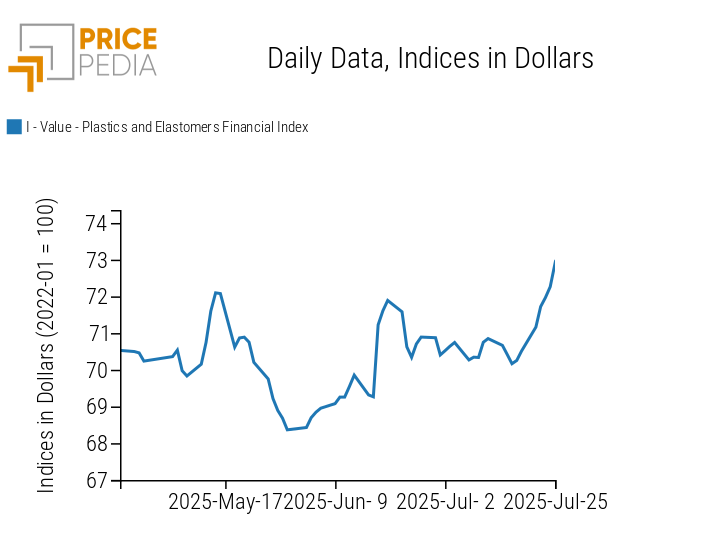
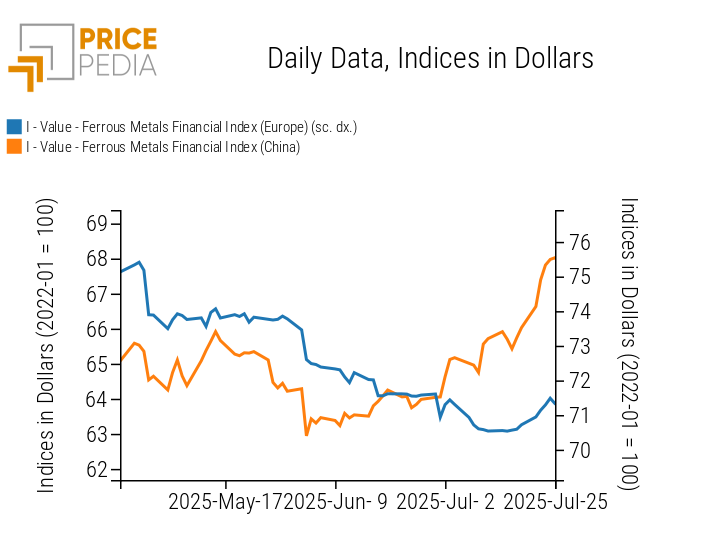
The effect of this renewed confidence is clearly reflected in the price dynamics of commodities traded on Chinese markets. The chart below shows the aggregated indices of dollar-denominated prices for ferrous metals and plastics and elastomers traded in Chinese financial markets. The acceleration of both indices in the past week is evident.
NUMERICAL APPENDIX
ENERGY
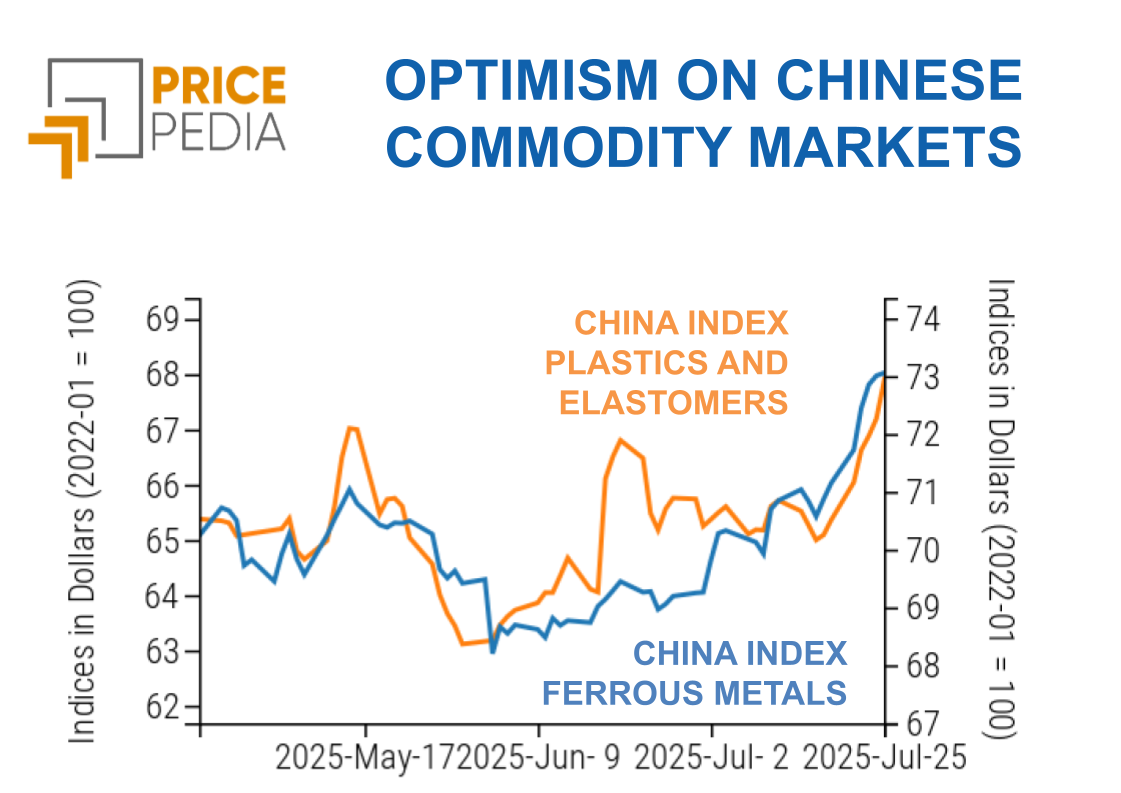
The PricePedia financial index for energy products shows a slight decline this week, returning to levels seen after the April 2 announcement of “reciprocal” tariffs by the American administration.
PricePedia Financial Index of Dollar Prices for Energy
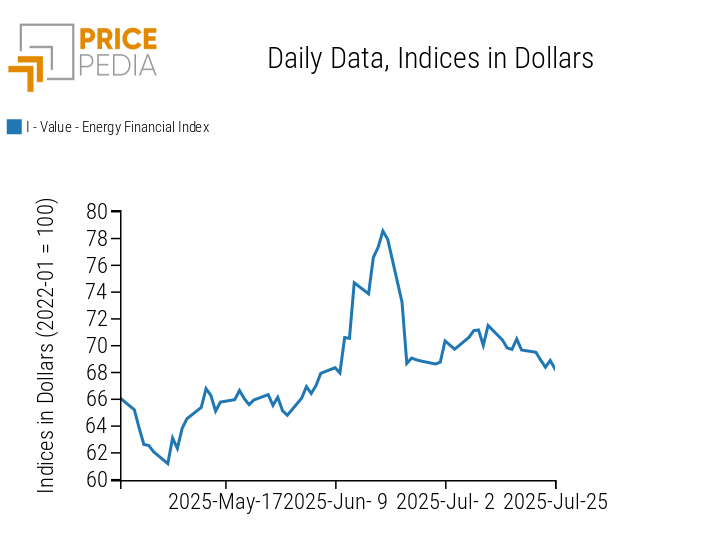
The energy heatmap shows that the area with the largest declines is natural gas, with a double-digit weekly price drop at the American Henry Hub.
HeatMap of Energy Prices in Euro
PLASTICS
The Chinese financial index for plastics and elastomers shows a significant acceleration of a growth phase that began several months ago.
PricePedia Financial Indices of Dollar Prices for Plastics
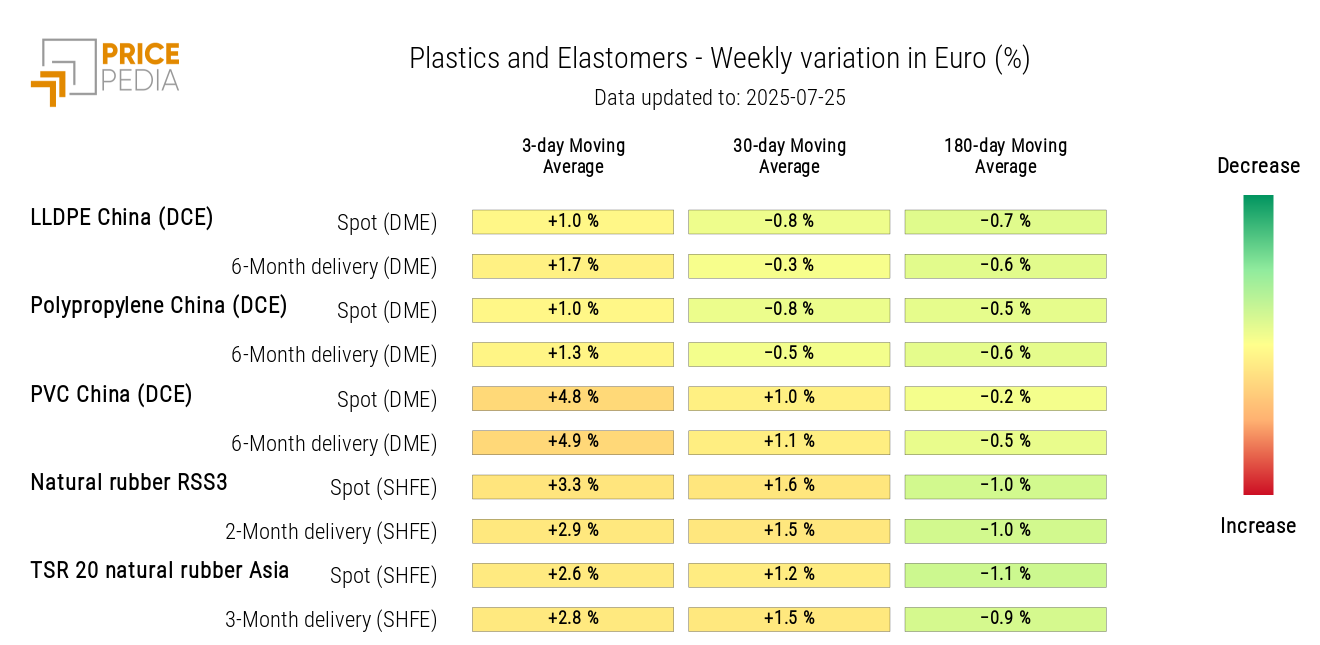
The heatmap analysis highlights the areas of natural rubber and PVC as those experiencing the strongest price growth.
HeatMap of Plastics and Elastomer Prices in Euro
FERROUS METALS
The index of Chinese ferrous metals recorded a sharp growth acceleration, which also influenced the European index.
PricePedia Financial Indices of Dollar Prices for Ferrous Metals
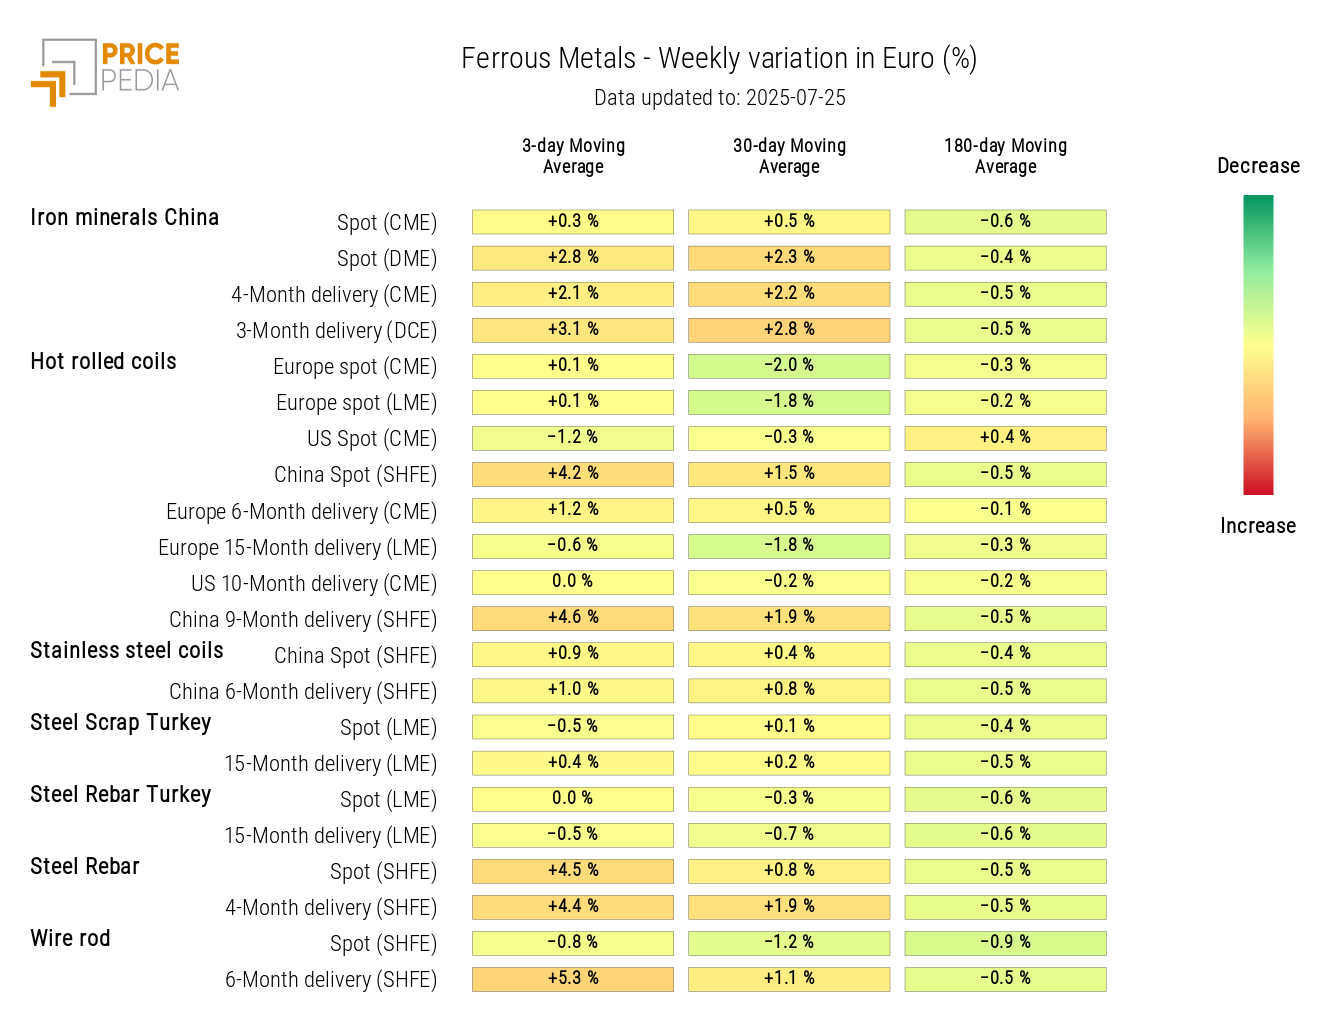
The heatmap for ferrous metals shows that the price increases mainly concern raw materials traded on the Chinese market.
HeatMap of Ferrous Metal Prices in Euro
Do you want to stay up-to-date on commodity market trends?
Sign up for PricePedia newsletter: it's free!
NON-FERROUS INDUSTRIAL METALS
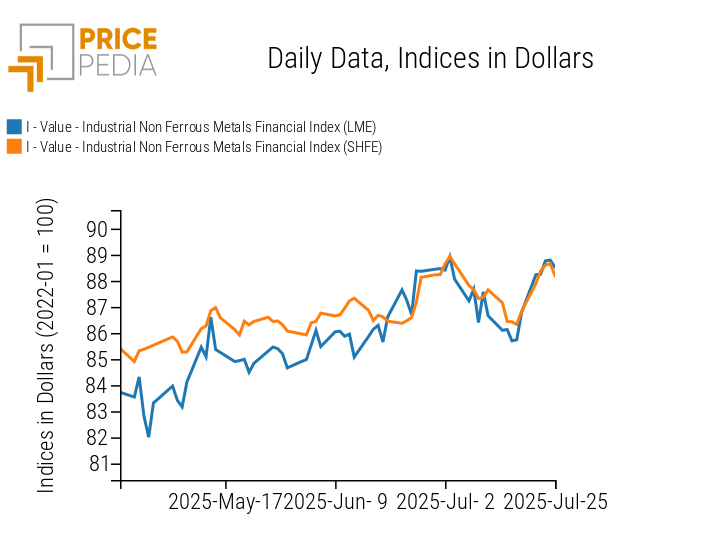
This week, the indices of non-ferrous industrial metals also reversed their trend, with a series of upward sessions through Thursday.
PricePedia Financial Indices of Dollar Prices for Non-Ferrous Industrial Metals
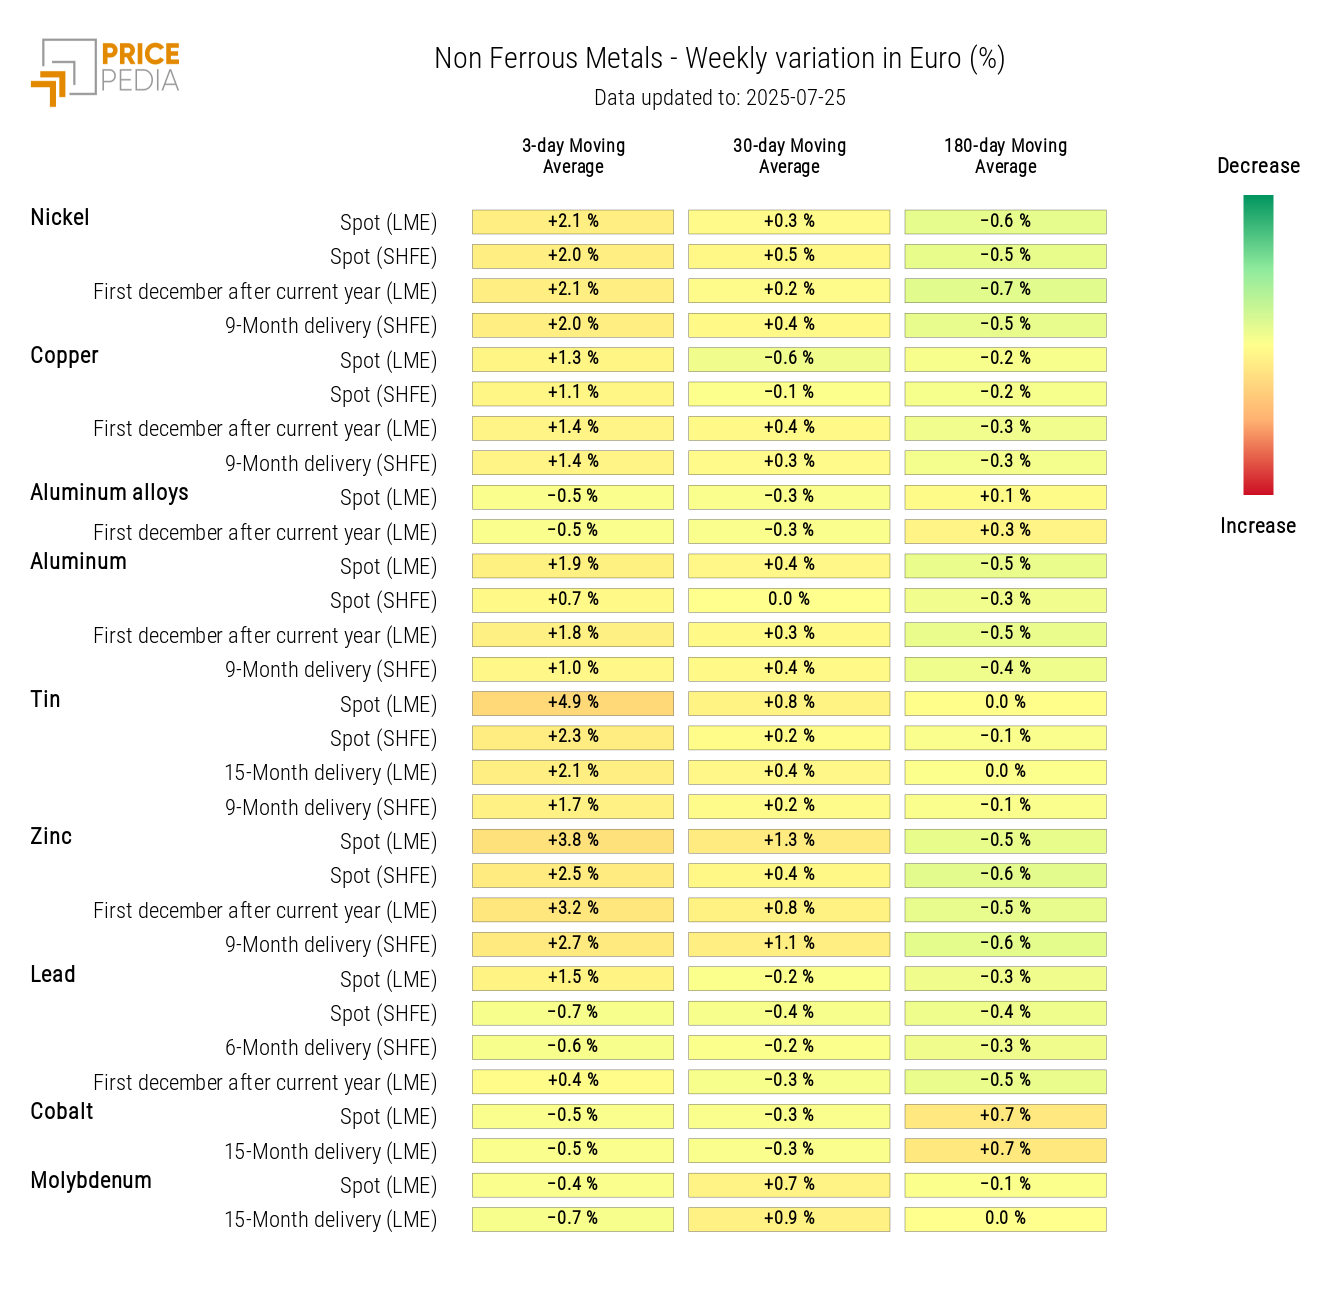
Heatmap analysis reveals a generalized upward trend, led by tin.
HeatMap of Non-Ferrous Metal Prices in Euro
FOOD COMMODITIES
The analysis of financial indices for food prices highlights the continued slow increase in the prices of edible oils, in contrast with a decline in prices for tropical commodities and cereals.
PricePedia Financial Indices of Dollar Prices for Food Commodities

CEREALS
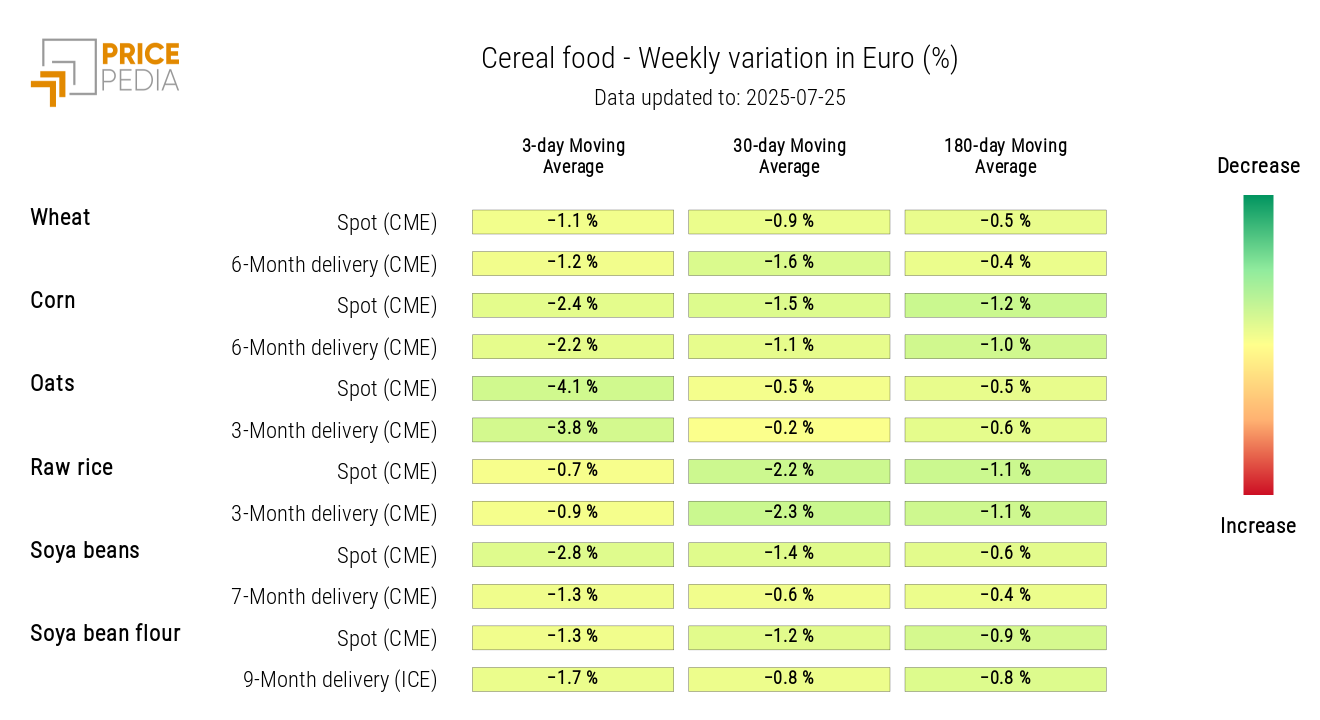
The cereals price heatmap shows a widespread decline, led by the price of oats.
HeatMap of Cereal Prices in Euro
TROPICAL
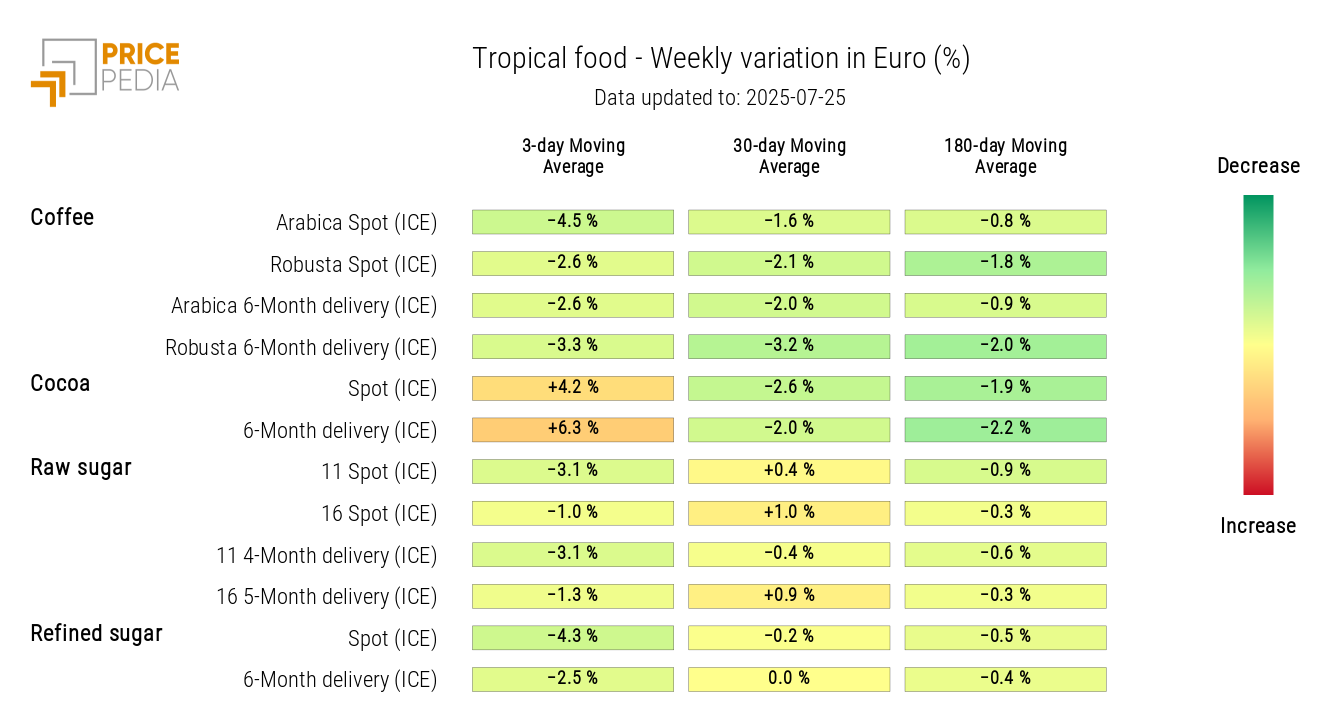
The tropical commodities heatmap highlights the continuation of diverging cycles in the prices of tropical products.
While cocoa prices increased, both coffee and sugar prices fell this week.
HeatMap of Tropical Food Prices in Euro
OILS
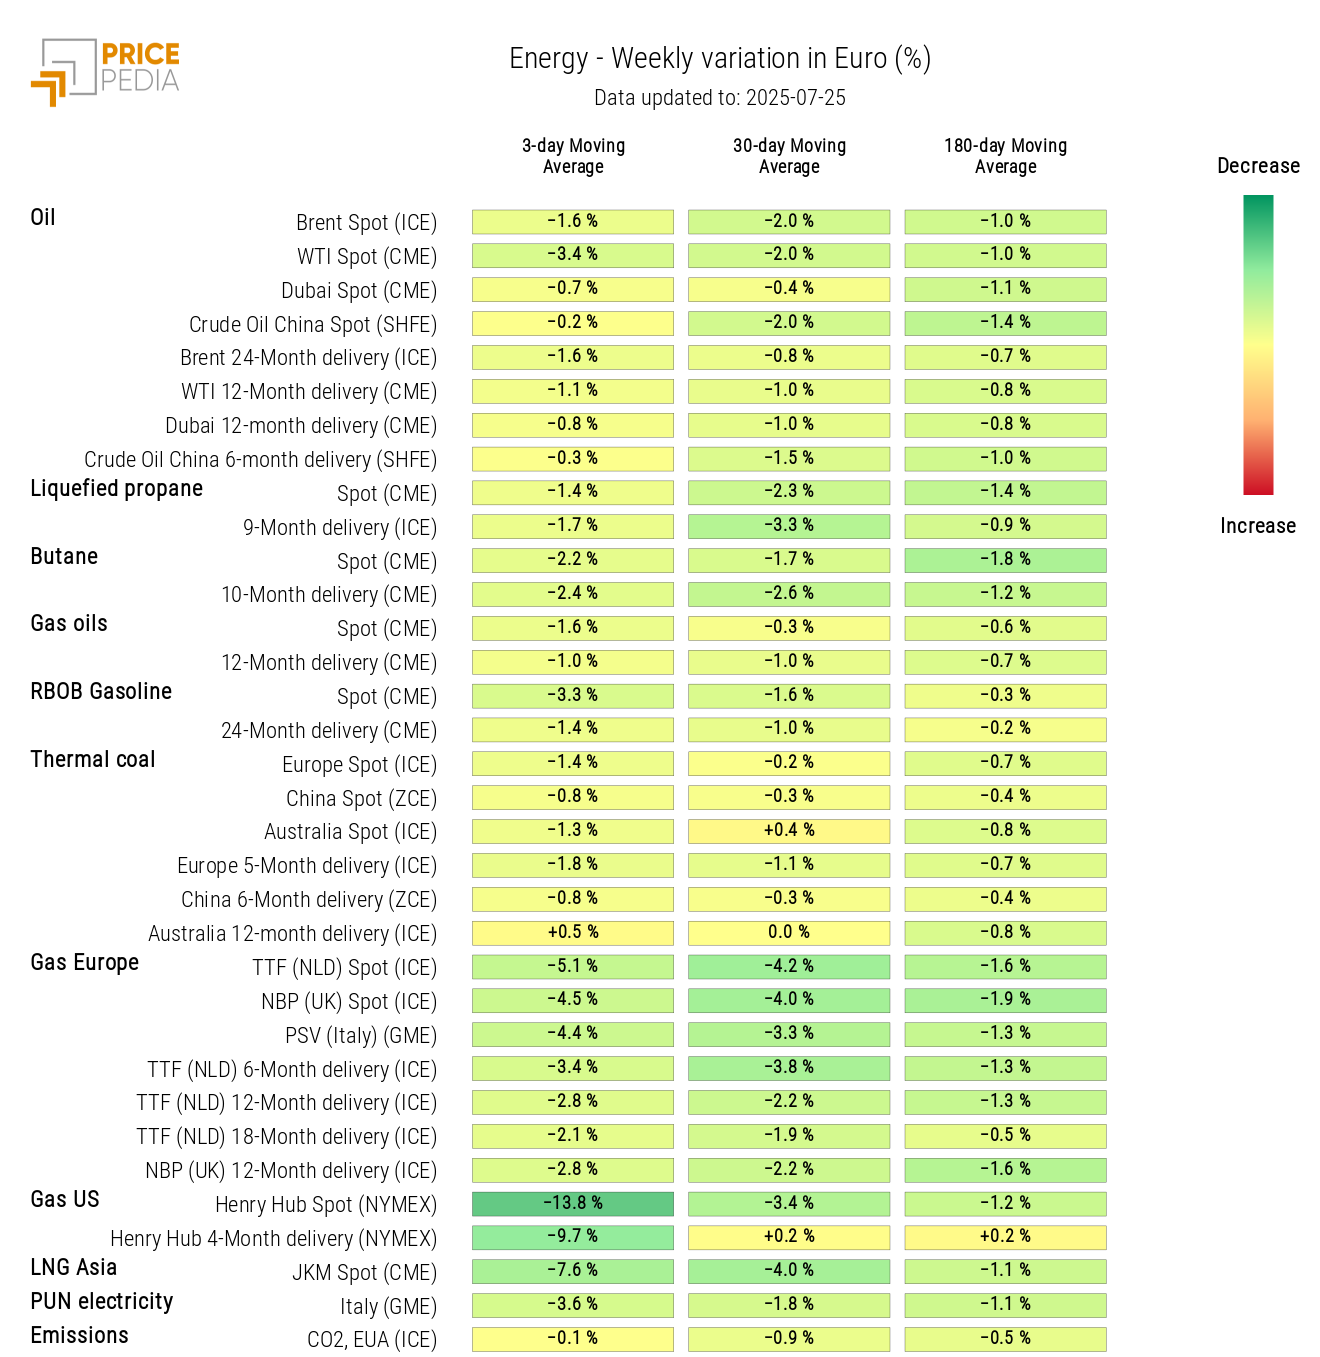
The edible oils heatmap shows overall price stability for all quoted oils.
HeatMap of Edible Oil Prices in Euro
