Financial markets waiting for US tariffs to come into force
Lack of clear direction in commodity markets
Published by Luca Sazzini. .
Conjunctural Indicators Commodities Financial WeekAt the beginning of the week, the United States sent official communications to trading partners with whom they have not yet reached an agreement, confirming tariffs similar to those announced on April 2. Unlike then, when markets reacted with a sharp drop, this time stock exchanges remained stable, also thanks to the decision to extend negotiations until the end of July. The countries involved thus still have a few weeks to negotiate and avoid the introduction of tariffs, which, according to the president, will come into force on August 1 without further postponements.
This week, however, financial markets were influenced by the announcement of new U.S. tariffs on copper imports at 50%. Following the announcement, copper prices on the CME rose by over 13% in just one day on Tuesday, while prices on the LME and SHFE recorded daily changes close to 0%. Financial operators, in fact, did not expect such high tariffs on copper, especially considering that the U.S. Department of Commerce has not yet published any assessment on the investigation launched in February, aimed at determining whether copper imports pose a threat to U.S. national security. This led to increased demand for CME copper ahead of the imminent introduction of tariffs, with stocks in Comex warehouses already exceeding those accumulated at the London Metal Exchange (LME) and the Shanghai Futures Exchange (SHFE). Despite this rise, the price increase is still not proportional to the 50% tariff announced by Trump. The market therefore seems partially hesitant about the actual enforcement of such a high tariff, currently pricing in only a 13% price increase.
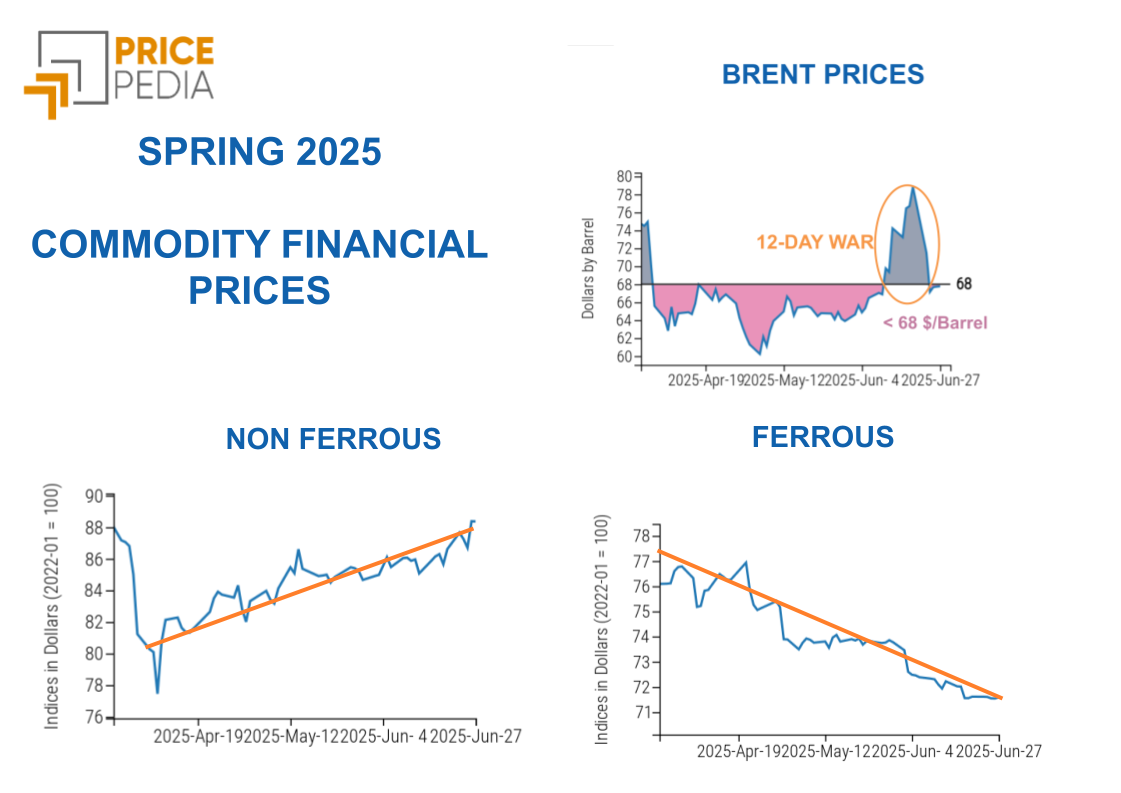
Weekly summary of commodity financial prices
This week, commodity financial markets followed diverging trends.
Oil, despite the new supply cut decided by OPEC+, started the week on an upward trend, supported both by seasonal demand and increased logistical risks. On Monday, in fact, the Houthi rebels claimed new attacks against ships transiting the Red Sea off the coast of Yemen, rekindling concerns over the safety of maritime routes. Later, crude oil prices began to fall again following the escalation between the United States and Brazil, a major producer and exporter of crude oil, with Trump threatening to impose tariffs of up to 50% on U.S. imports from Brazil.
Overall, the fundamental outlook for the oil market continues to exert downward pressure on prices. According to the Short-Term Energy Outlook (STEO) by the Energy Information Administration (EIA), future global oil supply growth will outpace demand growth, mainly driven by increased production in non-OPEC countries such as the United States, Brazil, Canada, and Guyana.
For 2025, the EIA forecasts an average Brent price of $69/barrel, down from 2024 but slightly higher than previous estimates, mainly due to recent geopolitical tensions in the Middle East between Israel and Iran. In 2026, however, a further decline is expected to $58/barrel, linked to the growing supply surplus in the global market.
Prices of European TTF natural gas followed an upward trend this week, driven by stronger-than-expected demand both in Europe and China, due to high temperatures.
The hot weather in China could intensify competition for LNG supplies with Europe, at a time when the EU is still increasing its stocks ahead of the next winter. High temperatures are in fact pushing up demand for natural gas used in power generation, needed to run air conditioning and cooling systems.
In the ferrous metals sector, there were some weekly fluctuations, with European prices slightly down and Chinese prices rising. As for non-ferrous metals, there was an overall drop in prices at the London Metal Exchange (LME) and the Shanghai Futures Exchange (SHFE), with the sharpest decline for copper. Currently, financial operators are preferring to buy copper listed on the CME rather than on the London and Shanghai exchanges, in anticipation of the new tariffs announced this week by President Trump. Among the metals bucking the trend, there was a recovery in prices for molybdenum and zinc.
In the food commodities sector, there were weekly declines among tropical commodities and especially cereals.
Prospects of larger harvests favored lower cereal prices, easing the previous week's gains linked to drought fears.
Among tropicals, it is noted that the spread between coffee prices, which widened last week, has narrowed again thanks to sharper declines for robusta compared to arabica.
FED Minutes
The minutes released this week show a Fed that remains cautious and divided on the future of interest rates.
A couple of FOMC members pointed out the opportunity for a rate cut as early as July, believing that the current level is now slightly restrictive. However, the majority of the committee prefers to wait for more convincing data, especially to assess the impact of the new tariffs on inflation dynamics. The minutes highlight the willingness not to completely rule out easing by the end of the year, but without the urgency of an immediate move. The scenario taking shape is that of a possible rate cut in the fall if data confirm a slowdown in inflation and the economy.
NUMERICAL APPENDIX
ENERGY
After a bullish start to the week, the PricePedia index of energy prices shows an upward trend, in line with oil price dynamics.
PricePedia Financial Index of energy prices in US dollars

The energy heatmap highlights the rise in Dutch TTF natural gas prices, alongside the decline in Italian prices at the Punto di Scambio Virtuale (PSV).
Although the TTF represents the main benchmark for European prices, the level of gas storage filling is currently uneven across countries: in Italy, for example, stocks have already exceeded 70% of maximum capacity, while in Germany and the Netherlands they stand at around 50%. These percentages are lower than in the same period last year, when storage levels reached 80% in Germany and over 70% in the Netherlands.
Energy price HeatMap in euros

PLASTICS
The Chinese financial index of plastics and elastomers, despite some fluctuations, closed the week at price levels substantially unchanged from the previous week.
PricePedia Financial Index of plastic prices in US dollars

FERROUS METALS
The gap between the trend of ferrous metal prices in Europe and China is widening: the European index continues its downward phase, while the Chinese index, net of fluctuations, shows a sharp increase.
PricePedia Financial Indices of ferrous metal prices in US dollars

The analysis of the heatmap shows an increase in iron ore prices in China and a rise in rebar prices quoted in Shanghai.
On the reduction side, there is a decrease in European hot rolled coil prices.
HeatMap of ferrous prices in euros

Do you want to stay up-to-date on commodity market trends?
Sign up for PricePedia newsletter: it's free!
INDUSTRIAL NON-FERROUS
The two financial indices of non-ferrous metals both show a downward price trend.
PricePedia Financial Indices of industrial non-ferrous metal prices in US dollars

The non-ferrous metals heatmap shows a weekly decline in copper prices, while on the rise side there are increases for molybdenum and zinc.
HeatMap of non-ferrous prices in euros

FOOD COMMODITIES
Against stable edible oils prices, there is a decline in the tropical commodities index and, above all, in the cereals index.
PricePedia Financial Indices of food commodity prices in US dollars

CEREALS
The cereals heatmap highlights an overall decrease in prices, especially for corn and soybeans.
HeatMap of cereal prices in euros

TROPICALS
The tropicals heatmap shows a sharp drop in robusta coffee prices and a slight increase in sugar prices.
HeatMap of tropical food commodity prices in euros

You may be interested in:
De-escalation in the Middle East dampens volatility in commodity markets
Published by Luca Sazzini. .
Conjunctural Indicators Commodities Financial WeekCommodities more stable, but tensions persist in food markets [ Read all ]
Commodity prices: June anomaly overcome
Published by Luca Sazzini. .
Conjunctural Indicators Commodities Financial WeekEnergy down on Middle East de-escalation; ferrous and nonferrous metals on divergent trends [ Read all ]
Geopolitical risks and energy security: the assessment of markets
Published by Luca Sazzini. .
Conjunctural Indicators Commodities Financial WeekRising volatility in food markets: between green challenges, substitution, and climate shocks [ Read all ]