PricePedia Scenario for July 2025
Macroeconomic uncertainty drives purchasing material prices downward
Published by Pasquale Marzano. .
Forecast Forecast
The PricePedia Scenario has been updated with information available as of July 3, 2025. The uncertainty resulting from U.S. trade policy, and how it is evolving toward various partner countries, continues to represent a constant in the current macroeconomic context. Since February 2025, U.S. tariff measures - especially those announced during the Liberation Day on April 2 - have led to a worsening of global economic recovery expectations and increased market volatility, further amplified by statements issued personally by President Trump.
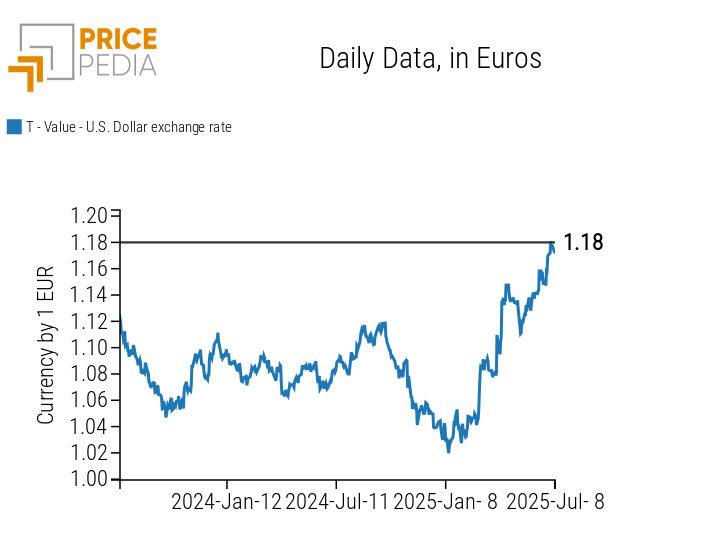
Among the variables affected by U.S. trade decisions, the U.S. dollar stands out. The chart below shows the daily trend of the dollar exchange rate against the euro.
Dollar exchange rate against the euro, Daily Data

Since mid-January, the dollar has depreciated against the euro by nearly 15%, falling from 1.02 on January 15 to 1.18 in early July.
In the coming weeks, an agreement is expected between the U.S. and the EU, one of America's most important trading partners. The July 9 deadline has recently been moved to August 1. On that same date, additional tariff measures are also expected to take effect against some Asian partners, including Japan and South Korea, as well as African countries.
The uncertainty surrounding the implementation of these measures tends to affect physical commodity markets, causing on the demand side the continuation of the current phase of weakness, and on the supply side a wait-and-see attitude among manufacturing firms, which are postponing investment decisions - just as outlined in the June 2025 price update.
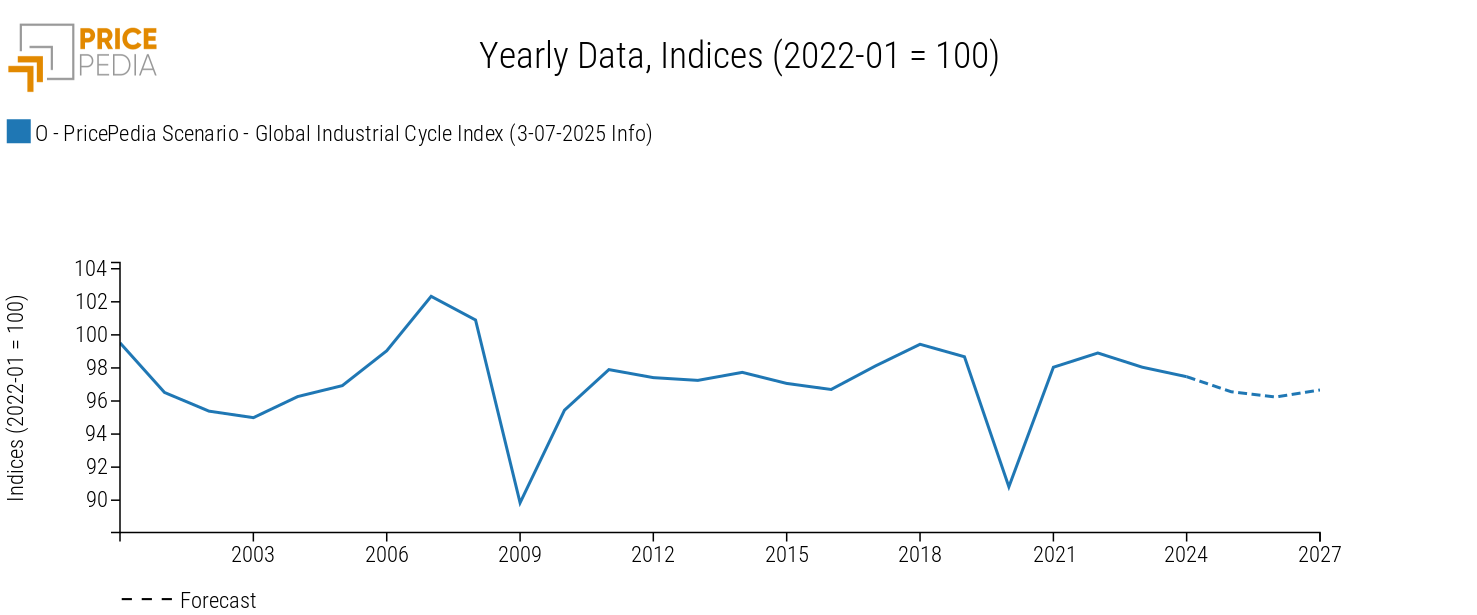
The effect of this context on the dynamics of the global industrial cycle[1] is shown in the chart below.
Global Industrial Cycle, July 2025 Scenario

The downward trend in the global industrial cycle, which began in 2022, is expected to continue through both 2025 and 2026. On average, this index is projected to decline by -2.7% in 2026 compared to annual values in 2022. A modest recovery is anticipated on an annual basis in 2027.
Forecast for purchasing material prices
Regarding the prices of raw materials and purchasing inputs, what is observed in the global industrial cycle may create a favorable situation for corporate procurement departments. On an aggregate level, in fact, the 2025-2026 period is expected to see an average reduction in commodity prices of -7.1%.
The table below shows the annual price variations in euros for the main commodity groupings included in the PricePedia Scenario: Industrial[2], Total Commodity[3], Total Energy, and Total Food.
Table 1: Annual Variation Rates (%) of PricePedia Aggregate Indices, in Euros
| 2024 | 2025f | 2026f | 2027f | |
|---|---|---|---|---|
| I-PricePedia Scenario-Commodity Index (Europe) (3-07-2025 Info) | −4.53 | −5.76 | −8.35 | −0.35 |
| I-PricePedia Scenario-Industrials Index (Europe) (3-07-2025 Info) | −4.53 | −1.13 | −2.13 | +0.55 |
| I-PricePedia Scenario-Energy Total Index (Europe) (3-07-2025 Info) | −5.89 | −12.58 | −13.73 | −0.66 |
| I-PricePedia Scenario-Food Total Index (Europe) (3-07-2025 Info) | +3.25 | +9.62 | −7.13 | −2.27 |
Looking at individual sub-categories, prices for energy raw materials are expected to decline in both 2025 and 2026, with an average annual drop of -13%. This trend is expected to stabilize in 2027, with a more moderate decrease of just -0.7%. From a cycle analysis perspective, by the end of the forecast period, energy price levels are expected to return to around 2021 levels.
During the 2025-2026 period, prices for industrial raw materials are forecast to fall by a total of -3.3% compared to the 2024 average. From a monthly trend perspective, the scenario confirms what was illustrated in the previous update, with the lowest point expected in the early months of 2026 and a slight rebound in prices in the latter part of the year.
A different trend is expected for food products, which are forecast to end 2025 with prices averaging +9% higher than the previous year, mainly due to the inherited price momentum of tropical goods. The reductions forecast for 2026 and 2027 will bring price levels slightly below the 2024 average.
1. The global industrial cycle index is constructed by purifying the actual dynamics of industrial production from its trend. Since the supply of commodities tends to vary according to long-term economic growth expectations, while the demand for commodities is more linked to actual cyclical uses, the global industrial cycle index tends to reproduce the conditions of tension between demand and supply on the commodity market: when it increases, it means that the demand for commodities increases more than the supply; vice versa when it decreases.
2. The PricePedia Industrials index results from the aggregation of the indices relating to the following product categories: Ferrous, Non-Ferrous, Wood and Paper, Chemicals: Specialty, Organic Chemicals, Inorganic Chemicals, Plastics and Elastomers and Textile Fibres.
3. The PricePedia Commodity index results from the aggregation of the indices relating to industrial, food and energy commodities.


