De-escalation in the Middle East dampens volatility in commodity markets
Commodities more stable, but tensions persist in food markets
Published by Luca Sazzini. .
Conjunctural Indicators Commodities Financial Week
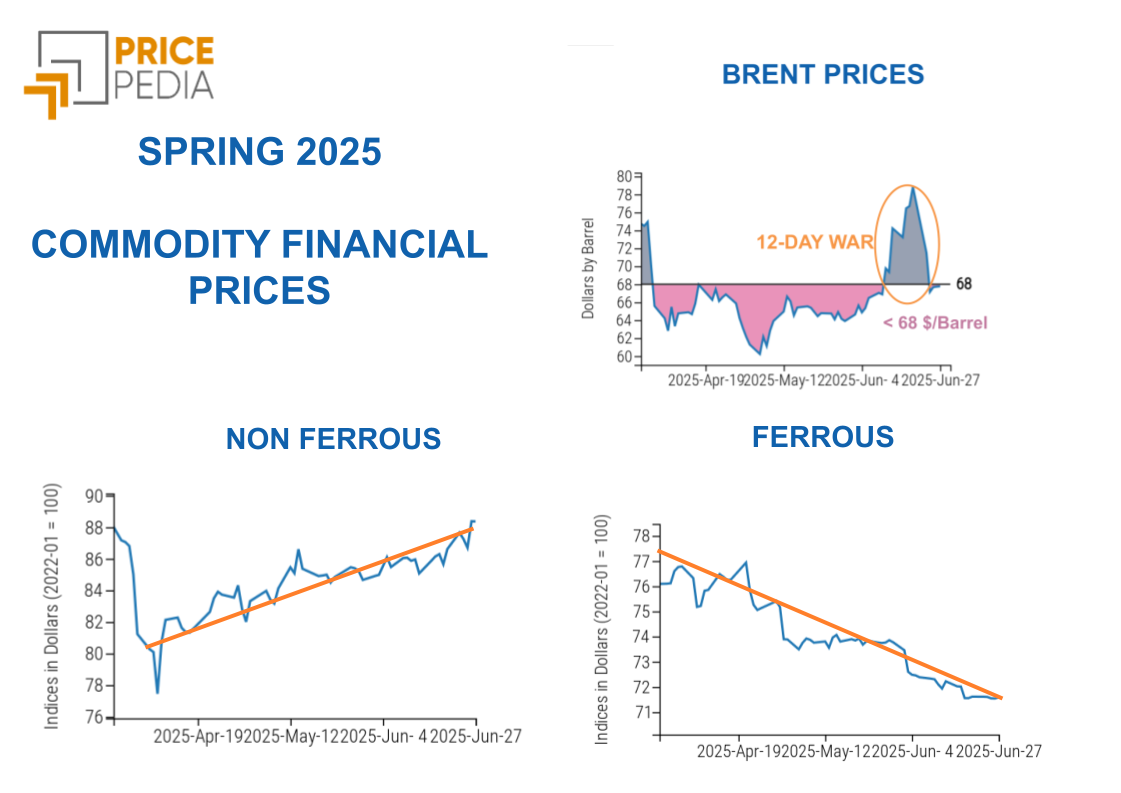
The end of the 12-day war in the Middle East has led to greater stability in commodity financial prices, especially in the energy sector, compared to the sharp fluctuations recorded in June.
This week, in fact, the price of oil remained relatively stable, except for an increase of around 3% recorded on Wednesday. This rise appears to be linked to an easing of tensions perceived by the markets, following President Trump’s announcements about the new trade deal with Vietnam.
According to what has been declared, the additional tariff on U.S. imports from Vietnam will be 20%, a rate significantly lower than the initial proposal of 46%. At the same time, a 40% tariff has been introduced on goods from third countries transiting through Vietnam, to counter potential triangulations. Furthermore, Trump stated that the United States will be able to export their goods to Vietnam without being subject to customs duties. However, it should be noted that although a compromise seems to have been reached between the two countries, no official document has yet been released confirming Vietnam’s acceptance of these conditions.
After the rise following these statements, oil prices then fell again, partly due to expectations of a further increase in production by OPEC+ at the meeting scheduled for July 6.
Still in the energy sector, the prices of Dutch TTF natural gas also showed greater stability, except for an increase of around 3% recorded on Tuesday.
In the industrial metals sector, there was a moderate recovery in prices in China, for both ferrous and non-ferrous metals, supported by a rise in the Chinese manufacturing PMI above analysts’ forecasts. In Europe, on the other hand, ferrous metal prices remain relatively stable, while non-ferrous metals quoted on the London Metal Exchange (LME) show slight increases, entirely attributable to the depreciation of the U.S. dollar.
The food commodity sector, however, was characterized by greater price volatility. Cereals, particularly oats, wheat and corn, recorded price increases due to adverse weather conditions affecting major producing countries.
Among tropical commodities, there was a decline in cocoa prices, due to forecasts of an abundant harvest in Ghana for 2025/26, according to estimates from the Ghana Cocoa Board. As for coffee, weekly price dynamics were mixed: arabica fell following heavy rains in Brazil, which eased drought concerns, while robusta rose due to expectations of a decline in Vietnamese exports, confirmed by Vietnam’s National Statistics Office and the Vietnam Coffee and Cocoa Association, which revised local production estimates downward.
In the edible oils market, there was a general increase in prices, particularly for soybean oil, driven by USDA forecasts indicating a reduction in soybean acreage in 2025.
Eurozone Inflation
This week saw the publication of Eurozone inflation data for June, measured by the Consumer Price Index (CPI). Annual inflation edged up slightly, standing at around 2%, in line with the ECB’s target.
Core inflation, which excludes food and energy, remained stable at 2.3%, indicating mild persistence of internal pressures but no signs of acceleration.
Overall, the data describe a picture of price stabilization: after months of decline, inflation is consolidating around the central bank’s target.
China PMI
New data on China’s June PMI (Purchasing Managers’ Index) show signs of stabilization and a moderate improvement, especially in the manufacturing sector, supported by the trade truce which boosted orders and production. Large enterprises show signs of expansion, but small and medium-sized ones remain under pressure, with a still weak labor market.
The services sector continues to expand, albeit at a slower pace, due to weaker domestic and external demand and strong price competition, which has eroded margins and selling prices.
NUMERICAL APPENDIX
ENERGY
After the intense turmoil generated by the war in the Middle East, this week the Pricepedia financial index of energy products shows greater price stability.
PricePedia Financial Index of energy prices in dollars

The energy heatmap shows a decrease in liquefied propane and butane prices, alongside an increase in thermal coal prices. Rising temperatures and greater use of air conditioners led to a sharp rise in Italy’s hourly PUN electricity price in the evening hours, pushing up the daily average PUN.
HeatMap of energy prices in euros

PLASTICS
The Chinese financial index of plastics and elastomers saw slight price fluctuations in opposite directions, partially offsetting each other.
PricePedia Financial Indices of plastics prices in dollars

FERROUS METALS
The China ferrous metals index follows a slight price increase supported by the recovery in Chinese PMIs, while the Europe index shows greater stability.
PricePedia Financial Indices of ferrous metals prices in dollars

The ferrous metals heatmap highlights a decrease in European hot-rolled coil prices and an increase in Chinese steel rebar prices.
HeatMap of ferrous prices in euros

Do you want to stay up-to-date on commodity market trends?
Sign up for PricePedia newsletter: it's free!
INDUSTRIAL NON-FERROUS METALS
Both financial indices in US dollars for industrial non-ferrous metals show a moderate price increase, supported by the depreciation of the US dollar.
PricePedia Financial Indices of industrial non-ferrous metals prices in US dollars

The heatmap analysis highlights the weekly stability of non-ferrous metals prices in euros.
HeatMap of non-ferrous metals prices in euros

FOOD
The financial indices of cereals and oils recorded weekly increases, while the tropicals index experienced a bearish turn.
PricePedia Financial Indices of food prices in US dollars

CEREALS
The cereals heatmap shows a price increase for oats, corn and wheat, while rice prices are declining.
HeatMap of cereals prices in euros

TROPICALS
The heatmap analysis highlights a weekly drop in cocoa prices.
Additionally, there is a different trend between the two coffee varieties: arabica prices are falling due to increased rainfall in Brazil, which has eased drought concerns, while robusta prices are rising as a result of expectations of lower production and exports from Vietnam, the world's largest producer of this variety.
HeatMap of tropical food prices in euros

OILS
The edible oils heatmap shows a general price increase, more marked for soybean oil.
HeatMap of edible oils prices in euros

You may be interested in:
Commodity prices: June anomaly overcome
Published by Luca Sazzini. .
Conjunctural Indicators Commodities Financial WeekEnergy down on Middle East de-escalation; ferrous and nonferrous metals on divergent trends [ Read all ]

Geopolitical risks and energy security: the assessment of markets
Published by Luca Sazzini. .
Conjunctural Indicators Commodities Financial WeekRising volatility in food markets: between green challenges, substitution, and climate shocks [ Read all ]
Commodity prices: the effects of escalation in the Middle East
Published by Luca Sazzini. .
Conjunctural Indicators Commodities Financial WeekStrong effects especially on the oil supply chain [ Read all ]