Commodity prices: June anomaly overcome
Energy down on Middle East de-escalation; ferrous and nonferrous metals on divergent trends
Published by Luca Sazzini. .
Conjunctural Indicators Commodities Financial WeekLast weekend, following the United States' attack on Iranian nuclear sites, Iran's parliament approved a motion in favor of closing the Strait of Hormuz—a strategic hub for the maritime transit of crude oil from the Persian Gulf. This news led many analysts to speculate on a new rise in energy prices, fueled by fears of a negative supply shock, considering that more than 20% of the oil transported by sea and over 30% of global liquefied natural gas pass through the Strait of Hormuz.
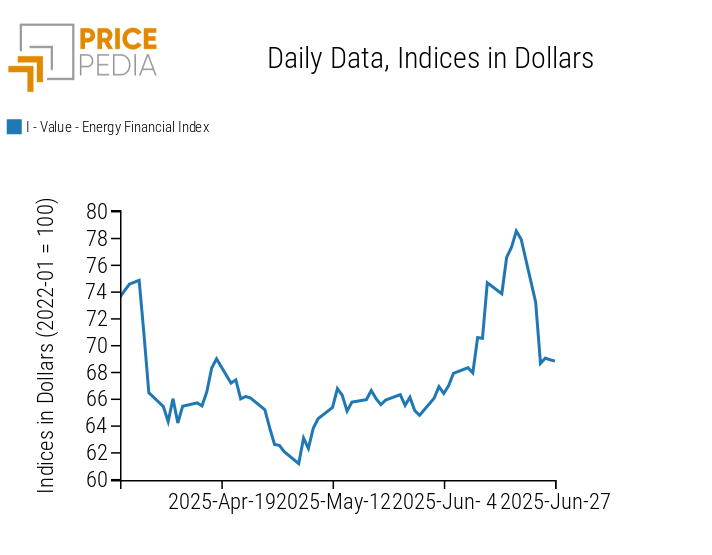
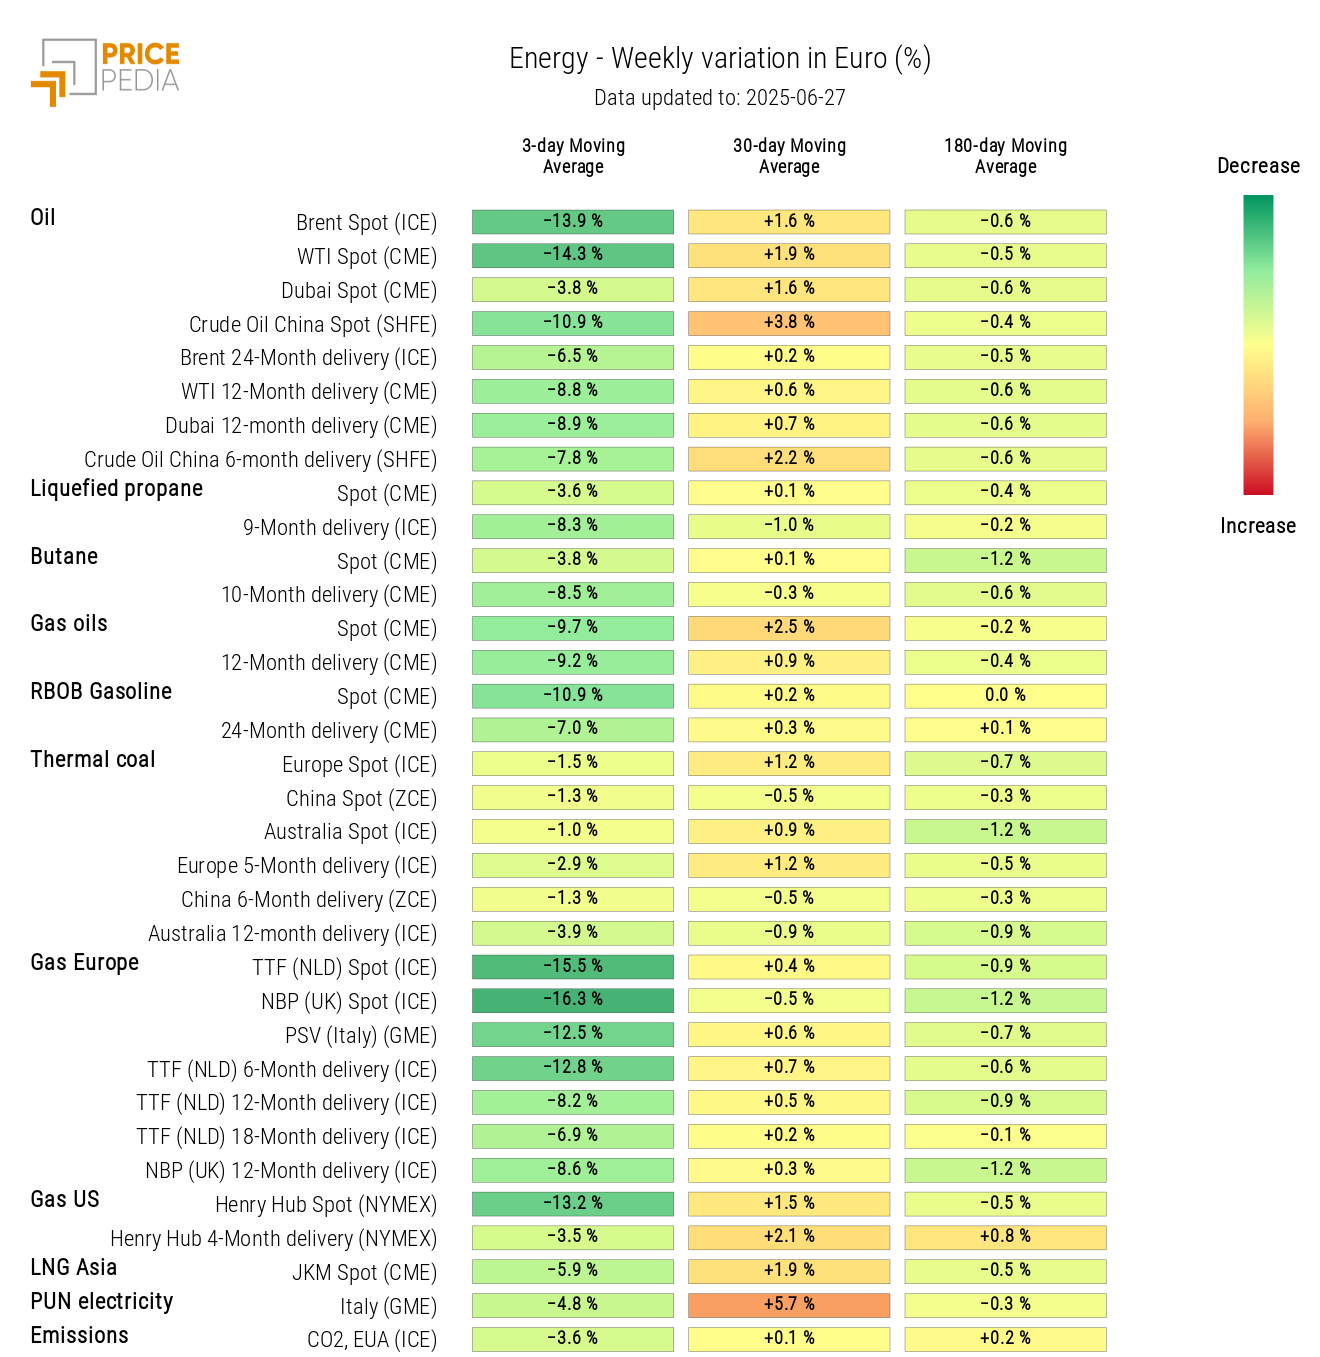
However, contrary to expectations, the start of the week saw a drop in energy prices, especially for oil: Brent prices fell by over 7% on Monday alone.
The market reaction reflected an assessment of de-escalation of the weekend events: no energy sites were hit, there were no casualties, and official statements ruled out a real intention by Tehran to proceed with blocking the Strait. In fact, closing this passage would be a severe blow to the Iranian economy because it would jeopardize its oil exports, the country's main source of revenue.
Some analysts suggested that the drop in oil prices was caused by financial operators who had access to privileged information, which allowed them to anticipate the actual easing of tensions in the Middle East. At the time of the price drop, the peace proposal later presented by President Trump between Iran and Israel had not yet been made public. Following this proposal, Brent prices registered a further decline of 6% on Tuesday, then stabilized around 67 dollars per barrel.
Prices of European TTF natural gas Netherlands also saw a sharp decline during the week. After an initial drop on Monday, prices collapsed definitively on Tuesday, falling by 12% following the peace proposal, and continued the downward trend for the rest of the week.
By contrast, prices of industrial metals, both ferrous and non-ferrous, remained relatively immune to news from the Middle East.
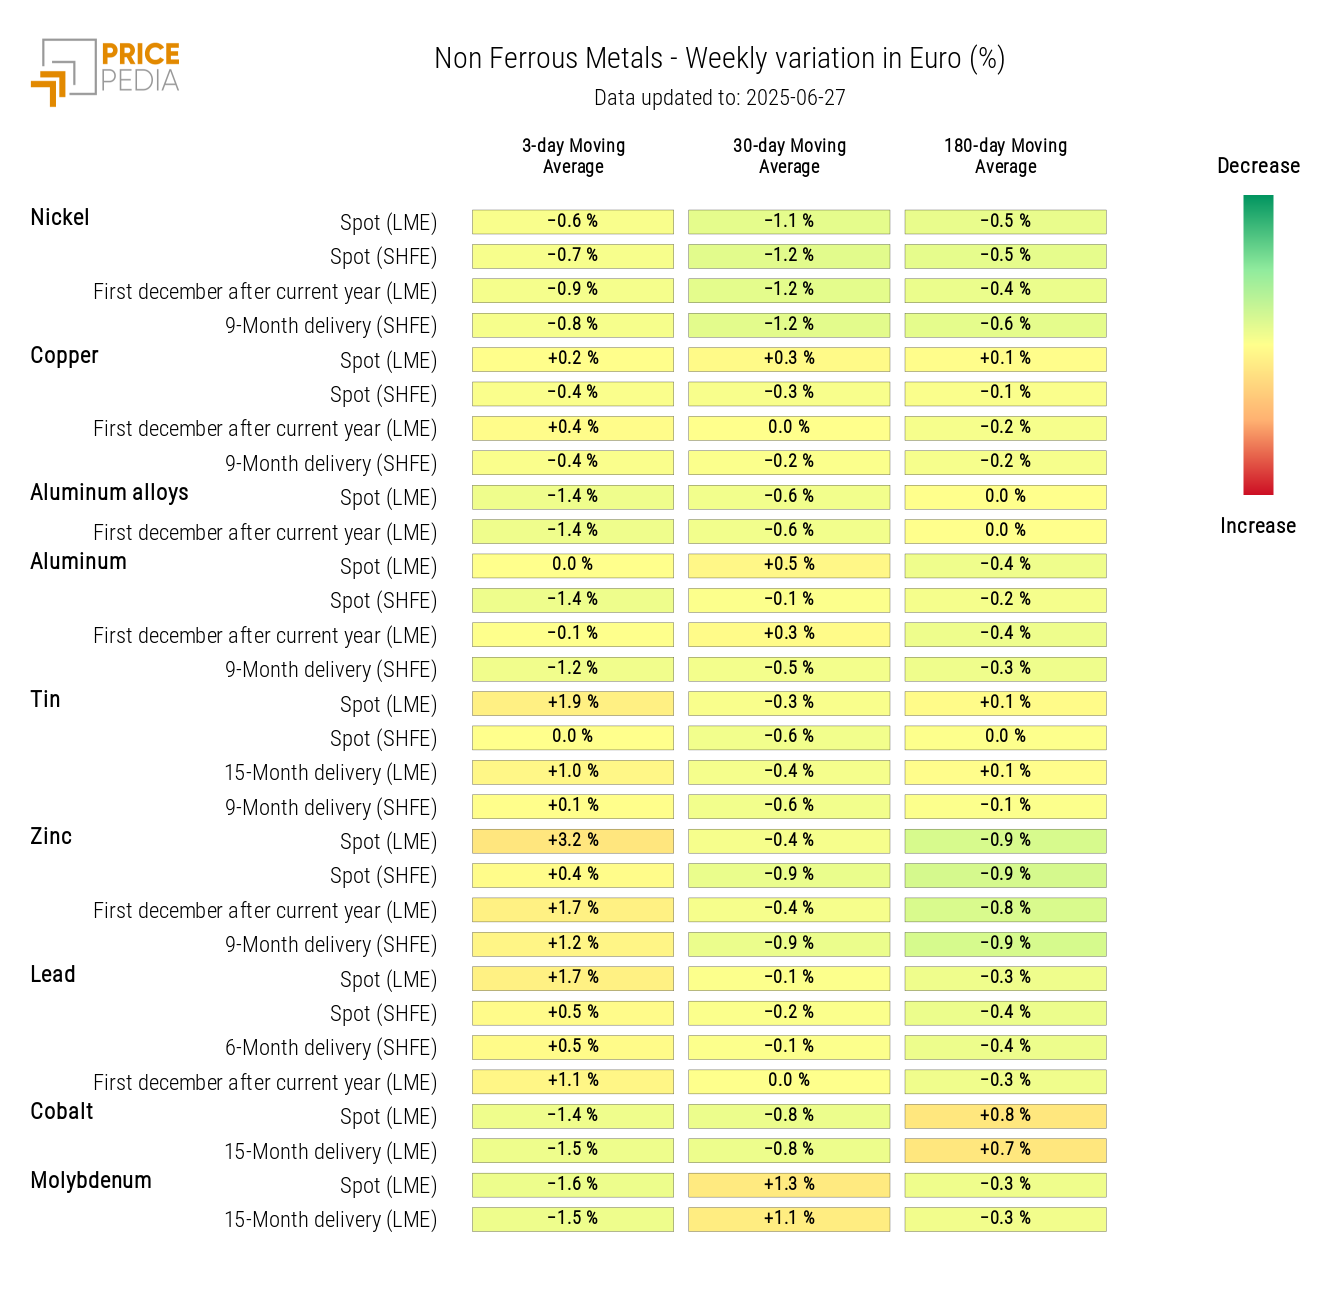
Among base metals, zinc recorded the most significant change, rising by 3%. The increase was supported by the announcement of a strike at the Peruvian Cajamarquilla smelter, the largest zinc smelter in Latin America, with an annual production capacity of about 345,000 tons.
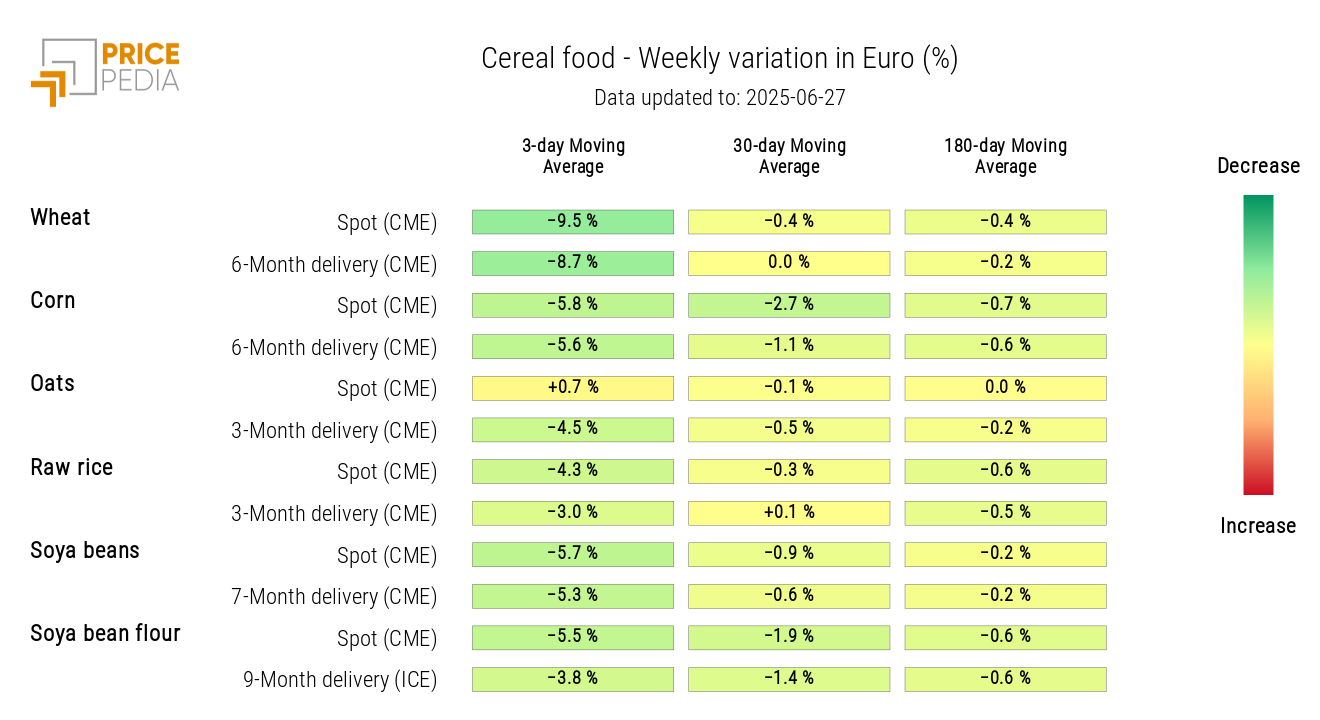
In the food sector, cereals and oils showed a reversal compared to last week’s price trends. In particular, the drop in oil prices partially offset the increases in soybean oil reported in last week’s analysis: "Geopolitical risks and energy security: the assessment of markets".
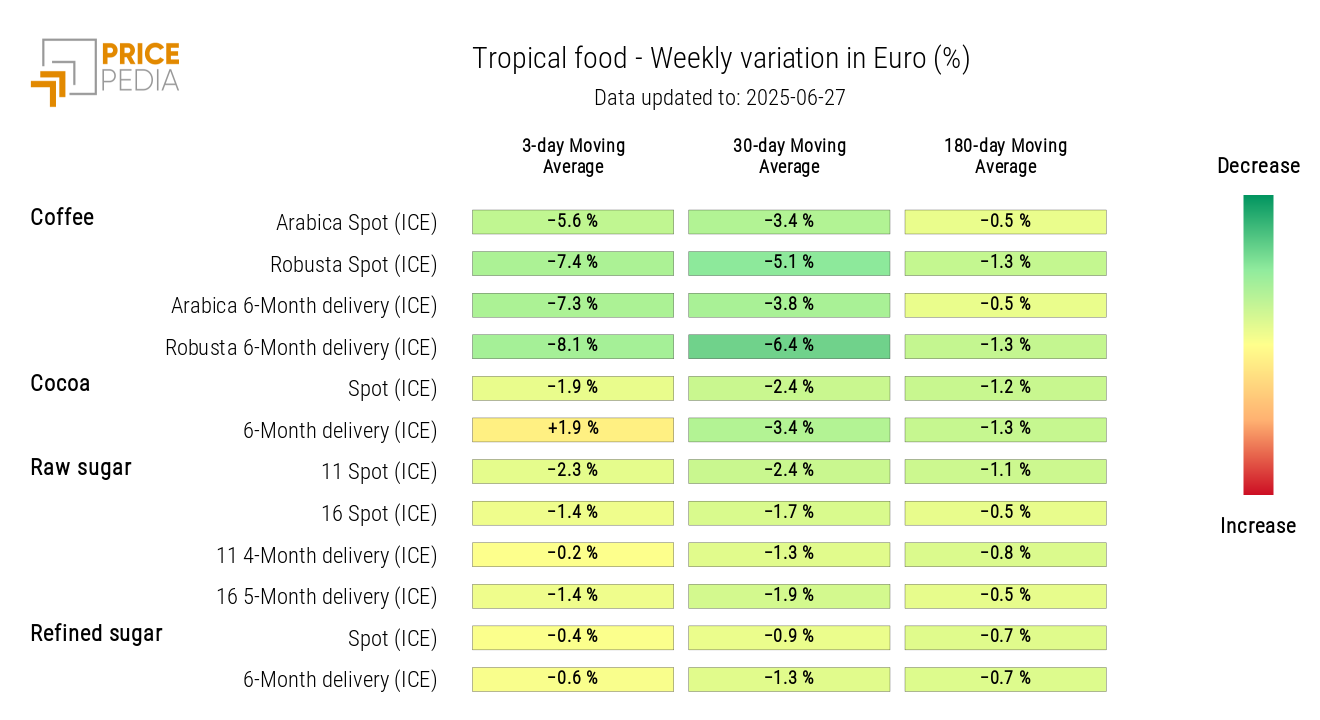
Tropical commodities showed mixed movements: while cocoa slowed last week's decline, coffee prices continued to fall, reflecting improved weather conditions in Brazil.
US Inflation
In May, US PCE inflation rose by 0.1% compared to April, with an annual rate reaching 2.3%. Core inflation, which excludes more volatile items like food and energy, rose by 0.2% month-on-month, reaching 2.7% year-on-year.
These data point to slight upward pressure on US prices, in line with analysts' expectations. Meanwhile, the Federal Reserve continues to take a cautious stance, closely monitoring the evolution of inflation, which is expected to increase due to President Trump's protectionist trade policies.
Macroeconomic Analysis
Flash PMI
The new flash estimates of the Purchasing Managers Index (PMI) show stagnation for the European economy and a slowdown in growth in the United States.
In Europe, all June flash PMI indices remained unchanged compared to May data.
The manufacturing sector continues to represent the most critical point for the eurozone, with figures confirming a phase of contraction and results below analysts' expectations.
In the United States, there is a slowdown in manufacturing growth and stability in the services sector, although both PMIs remain above analysts' forecasts.
These figures confirm the current resilience of the American economy, which continues to grow beyond expectations.
China Outlook
In China, economic growth remains solid, driven by the manufacturing sector and domestic consumption.
In the first quarter, GDP maintained a pace above 5% year-on-year, confirming robust expansion. However, in the second half of the year, a gradual moderation is expected, offset by the intensification of stimulus measures introduced by the authorities.
Currently, the main vulnerabilities of the Chinese economy remain the pressure from US-imposed trade tariffs and the persistent weakness of the real estate market.
NUMERICAL APPENDIX
ENERGY
After weeks of rising prices, the PricePedia financial index of energy products suffered a sharp weekly decline due to easing tensions in the Middle East.
PricePedia Financial Index of energy prices in dollars
The energy heatmap turned green, highlighting sharp declines in oil and natural gas prices.
HeatMap of energy prices in euros
PLASTICS
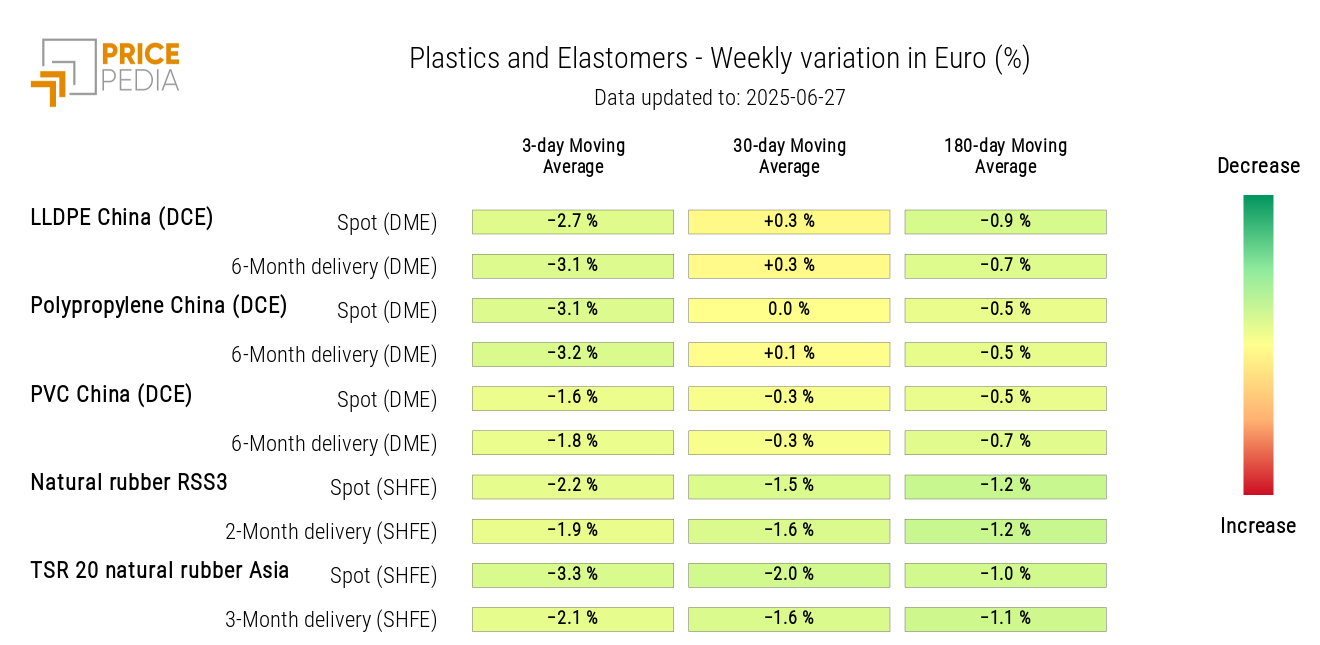
The Chinese financial index of plastics and elastomers fell at the start of the week, partially recovering in the last few days.
PricePedia Financial Indices of plastics prices in dollars

The heatmap shows a general decline in Chinese thermoplastics and elastomers prices.
HeatMap of plastics and elastomers prices in euros
FERROUS METALS
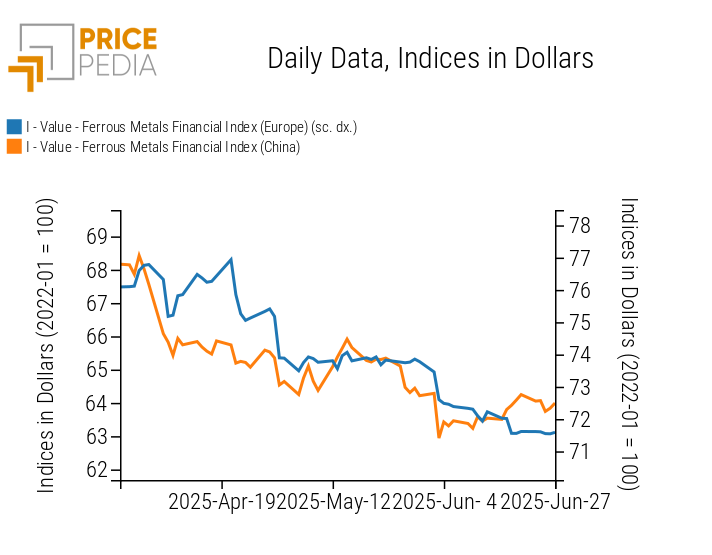
The European index of ferrous metals followed a lateral weekly trend, while the Chinese index showed a slight decline.
PricePedia Financial Indices of ferrous metals prices in dollars
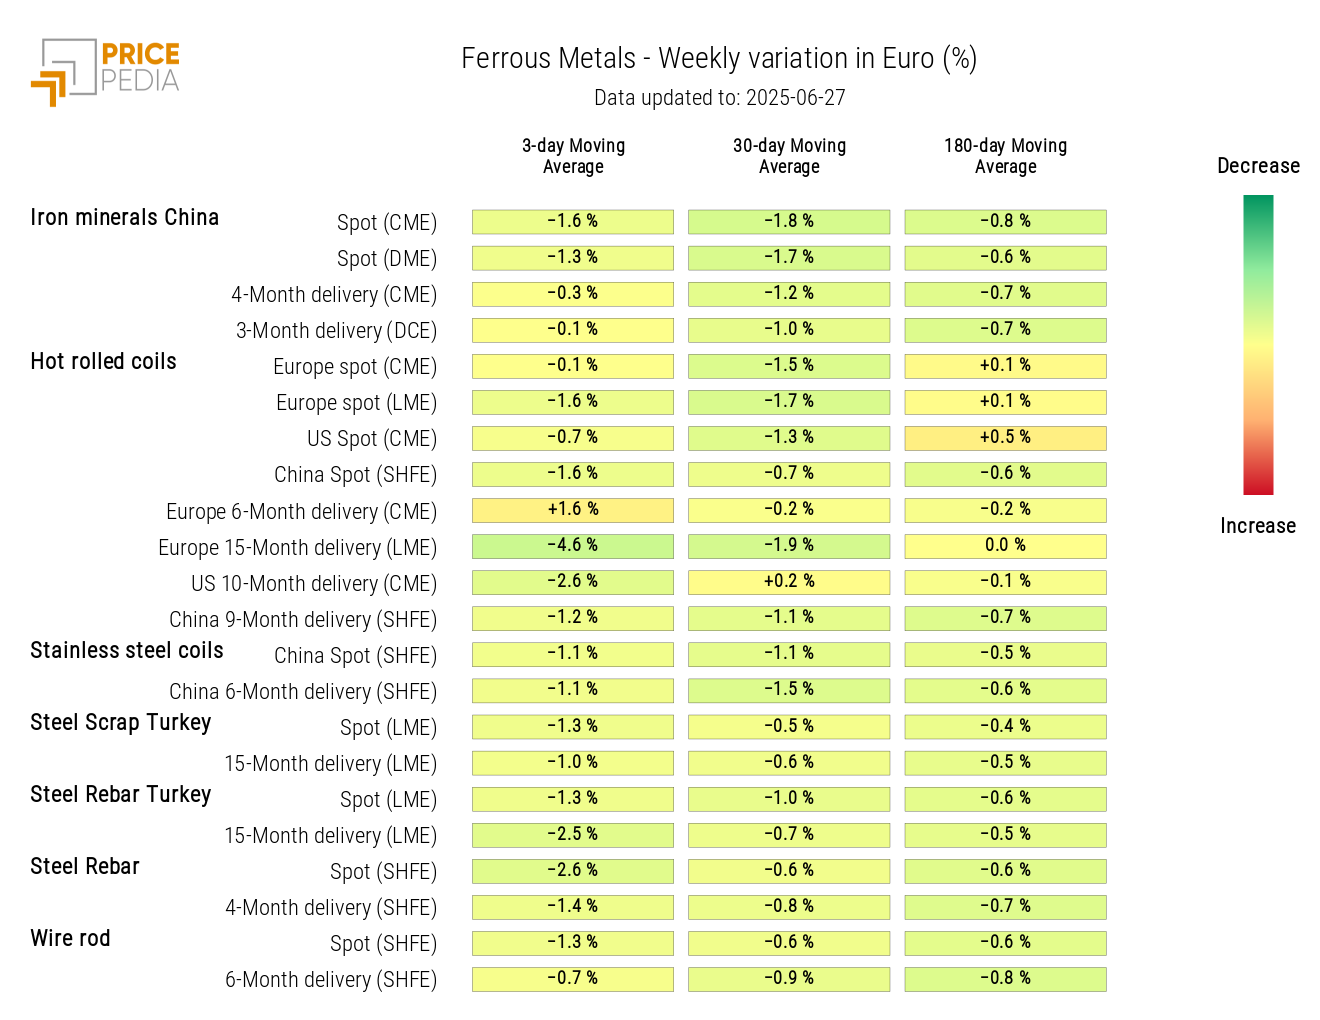
The ferrous metals heatmap shows weekly price reductions, although limited.
HeatMap of ferrous metals prices in euros
Do you want to stay up-to-date on commodity market trends?
Sign up for PricePedia newsletter: it's free!
NON-FERROUS INDUSTRIAL METALS
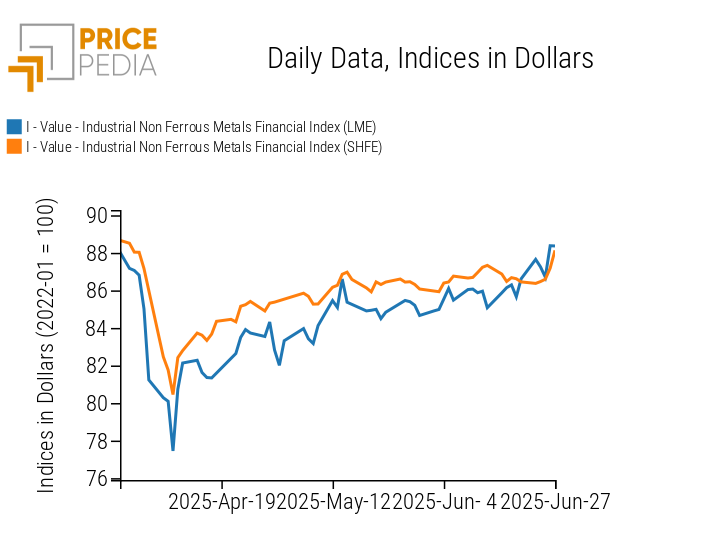
Net of fluctuations, the two indices of non-ferrous metals record slight price increases.
PricePedia Financial Indices of industrial non-ferrous metals prices in dollars
The heatmap analysis shows a weekly increase in the price of zinc.
HeatMap of non-ferrous metals prices in euros
FOOD COMMODITIES
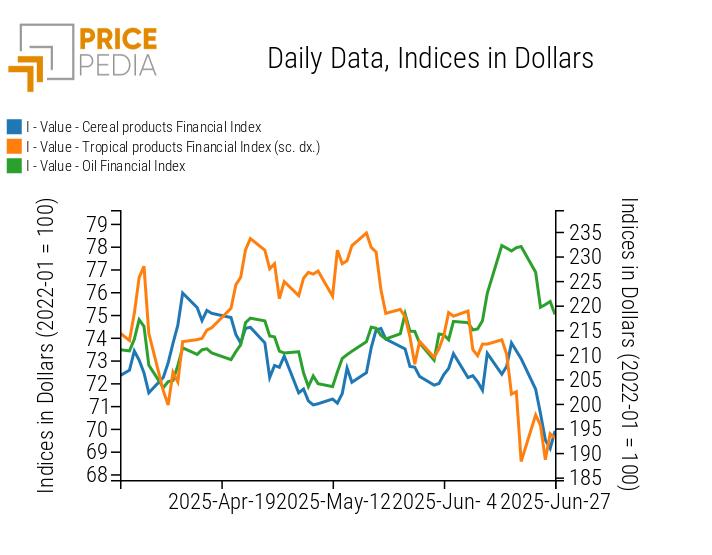
The analysis of financial price indices for food commodities highlights a collapse in cereals and oils, alongside fluctuations in tropical commodities.
PricePedia Financial Indices of food prices in dollars
CEREALS
The heatmap shows a sharp drop in cereal prices, especially for wheat.
HeatMap of cereals prices in euros
TROPICAL COMMODITIES
The tropical commodities heatmap shows a weekly reduction in coffee prices.
HeatMap of tropical food prices in euros
EDIBLE OILS
The heatmap highlights a general decline in edible oil prices, especially for canola oil and soybean oil.
HeatMap of edible oils prices in euros


