Commodity prices: the effects of escalation in the Middle East
Strong effects especially on the oil supply chain
Published by Luca Sazzini. .
Conjunctural Indicators Commodities Financial WeekThe attack carried out by Israel against Iranian nuclear targets triggered an immediate surge in oil prices, reigniting fears of a military escalation in the Middle East. The possibility of retaliation by Iran and the risk of a broader conflict make the Persian Gulf area particularly vulnerable, as it is a major transit point for global crude oil exports.
Although OPEC currently has unused production capacity and could accelerate supply increases to ease market tensions, a potential blockade of the Strait of Hormuz — a crucial oil transport route — would jeopardize a large share of global supply. These concerns have sparked a spike in volatility in energy financial markets, with crude oil prices recording an intraday peak of up to 13% during the early hours of Friday's session. Brent ended the week at $74.2/barrel, fully recovering the drop that followed the reciprocal tariffs of April 2.
Even before Friday’s increase, financial oil prices had been on an upward trend, supported not only by geopolitical tensions but also by other factors, including:
- progress in trade negotiations between the US and China, which fueled expectations of stronger crude oil demand;
- the new forecasts from the Energy Information Administration (EIA), projecting a slowdown in US oil production in 2026;
- the depreciation of the US dollar, which contributed to the rise of many dollar-denominated commodities, including oil.
In addition, prices of petroleum products have also been affected by the European Commission’s proposal to ban the import of refined products derived from Russian oil, even if processed in third countries. If approved, the measure would particularly impact imports from India and Turkey, two countries that refine Russian crude and export the finished products to the EU.
Financial prices of TTF natural gas (Netherlands) experienced high volatility throughout the week. After an initial drop driven by increased European storage levels, the TTF price climbed again following the escalation of geopolitical tensions, closing the week at 37.9 euros/MWh.
Among industrial metals, the divergent trend observed in recent weeks between ferrous and non-ferrous metal indices continued: the former declining, the latter increasing.
Trade Developments
New progress was made on the trade front last week, following the June 11 London agreement. China announced a relaxation of export restrictions on rare earths, approving a number of export licenses to the United States and Europe, initially valid for six months. At the same time, the United States expressed willingness to lift some export restrictions on chips and to facilitate the admission of Chinese students to American universities, while keeping reciprocal tariffs in place.
Although these openings have helped foster a more positive and constructive atmosphere in bilateral relations, the situation remains complex: President Trump continues to exert pressure on other trade partners, announcing his intention to impose unilateral tariffs on countries with which no agreement is reached by July 9.
While the United States is adopting a protectionist policy to safeguard its domestic industry, China is taking the opposite approach by aiming to strengthen economic ties with Africa. During the China-Africa Cooperation (FOCAC), President Xi Jinping announced his intention to eliminate tariffs for the 53 African countries with which China maintains diplomatic relations. He also offered more favorable trade conditions to the least developed African nations to boost their exports to the Chinese market.
US and China Economic Outlook
US Inflation
In May, US inflation, as measured by the Consumer Price Index (CPI), rose by 2.4% year-on-year, slightly below the 2.5% forecast. While this figure can be interpreted positively, it remains essential to monitor the potential impact of the new trade tariffs, which could push inflation above analysts' estimates in the coming months. Another risk is a potential increase in oil prices due to the escalating conflict between Israel and Iran.
China’s Foreign Trade
In May, Chinese exports rose by 4.8% y/y, below the expected 6% and down from April’s 8.1% y/y growth. A sharp decline was recorded in Chinese exports to the United States (-34.4%), while exports to the EU, Africa, and ASEAN countries accelerated.
Imports fell by -3.4% y/y, above the expected -0.8%. The decline mainly affected imports from the United States, which dropped from -13.6% y/y in April to -17.95% y/y in May. Analysts foresee a further slowdown in foreign trade in the second half of the year due to US trade tariffs.
NUMERICAL APPENDIX
ENERGY
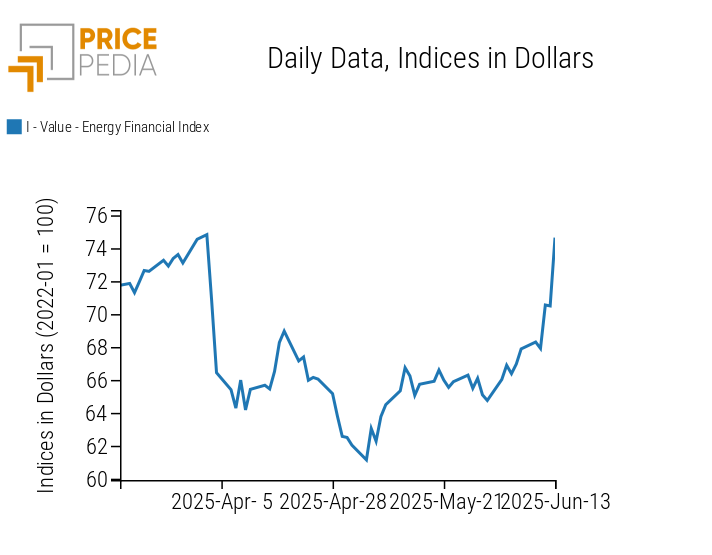
The PricePedia energy index continues the upward trend observed last week.
PricePedia Financial Index of Dollar-Denominated Energy Prices
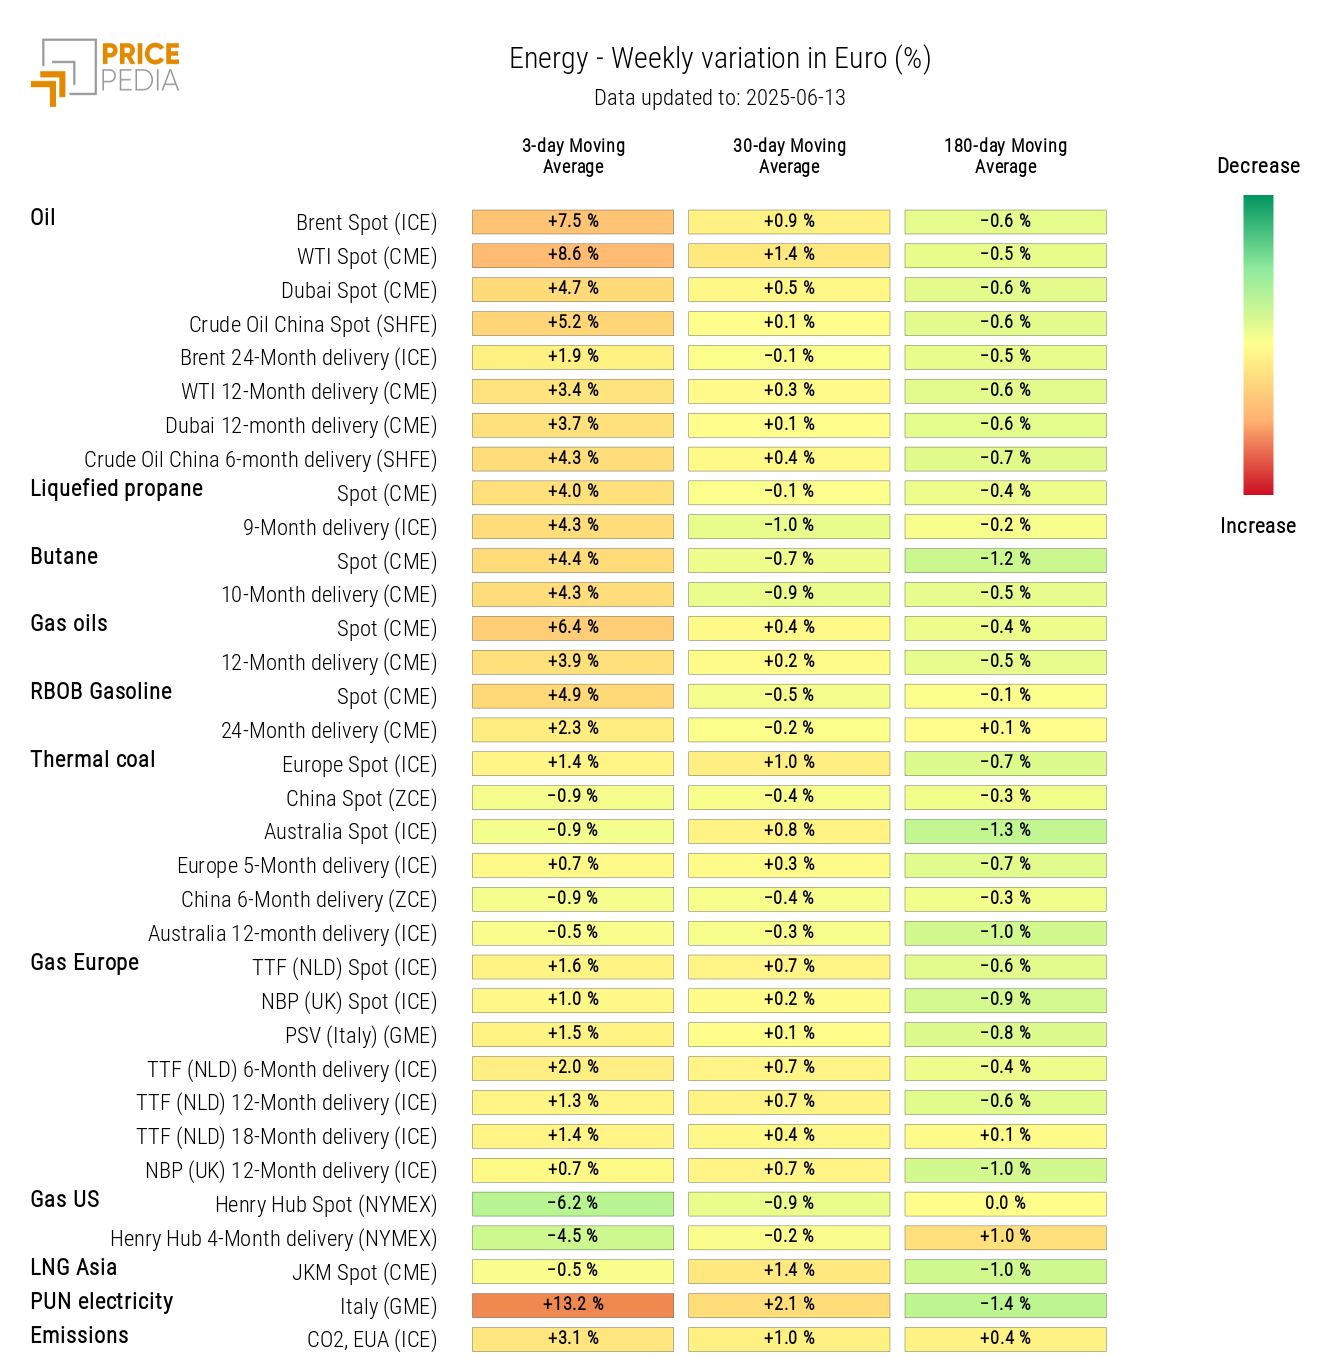
The energy heatmap shows a generalized increase in oil and petroleum product prices.
In contrast, US natural gas prices declined.
HeatMap of Energy Prices in Euroo
PLASTICS
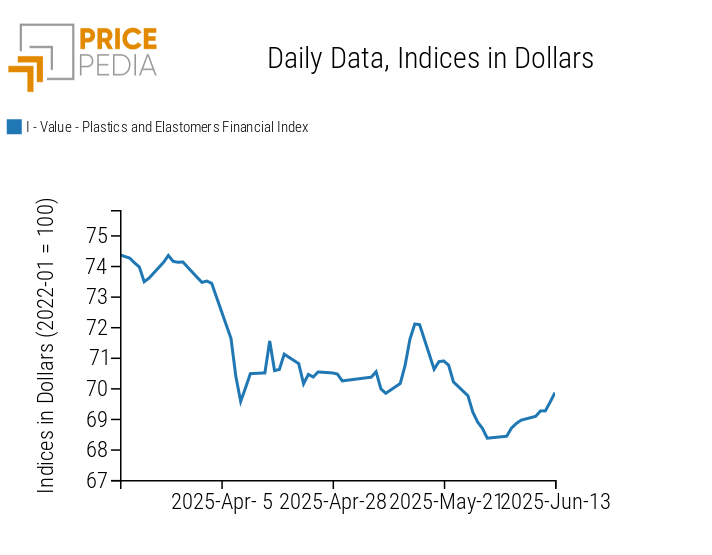
The Chinese financial index of plastics and elastomers, expressed in dollars, shows a slight price recovery, supported by the depreciation of the US dollar and the increase in oil prices.
PricePedia Financial Indices of Dollar-Denominated Plastic Prices
FERROUS METALS
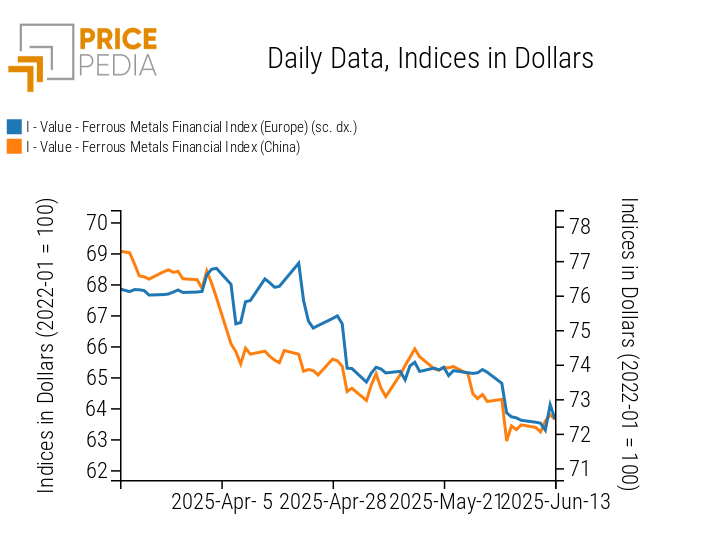
The financial indices of ferrous metals, expressed in dollars, recorded some price increases due to the depreciation of the US dollar. However, the underlying trend remains downward.
PricePedia Financial Indices of Dollar-Denominated Ferrous Metal Prices
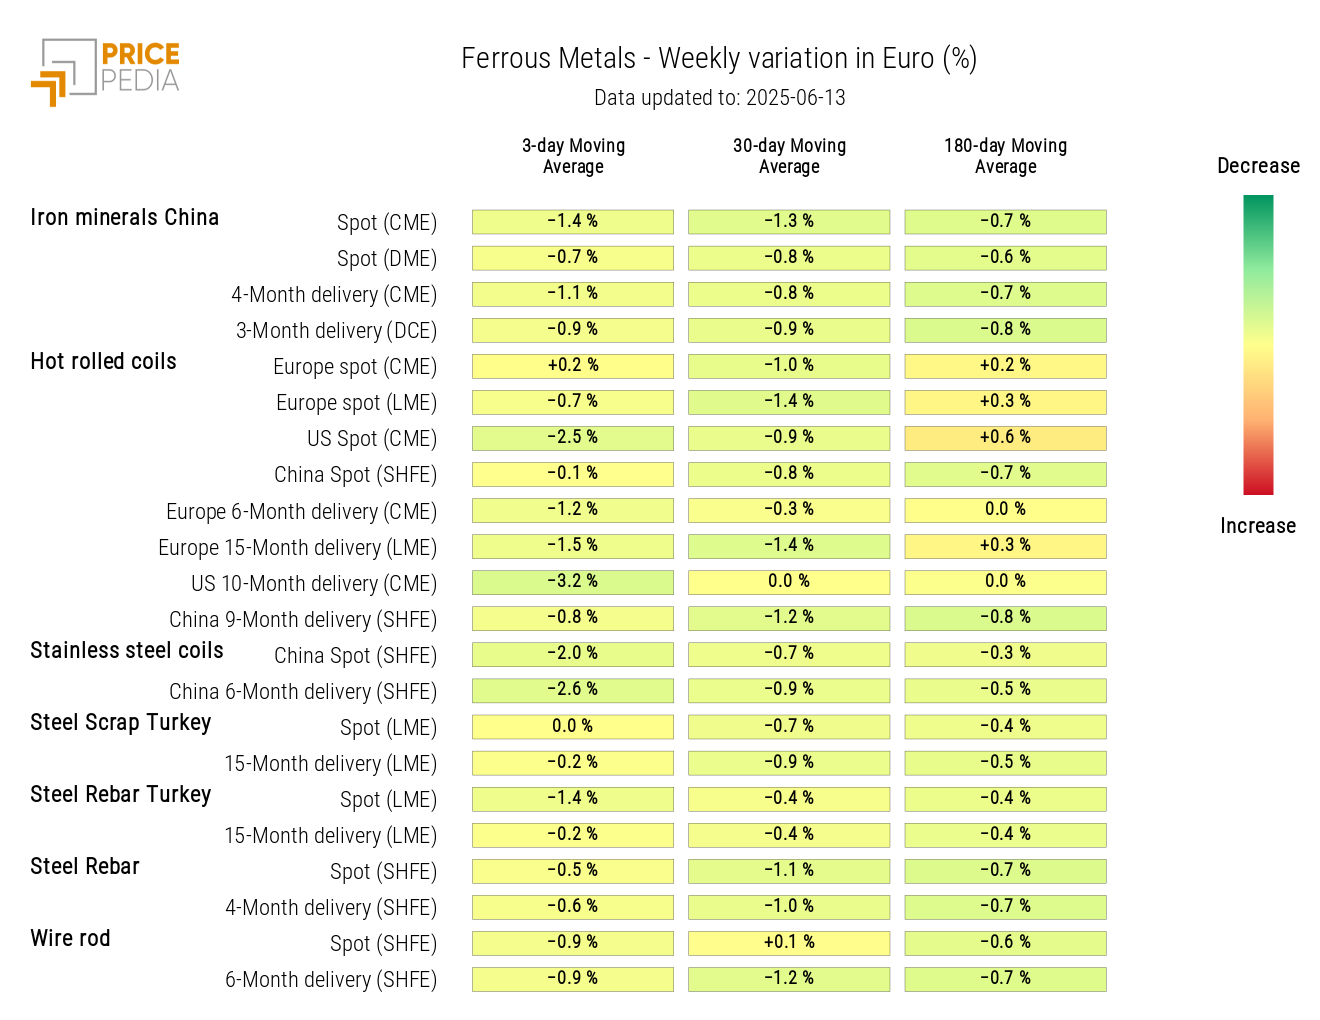
An analysis of the heatmap highlights the decline in Chinese iron ore prices and US hot rolled coil prices listed on the Chicago Mercantile Exchange (CME).
HeatMap of Ferrous Prices in Euroo
Do you want to stay up-to-date on commodity market trends?
Sign up for PricePedia newsletter: it's free!
INDUSTRIAL NON-FERROUS METALS
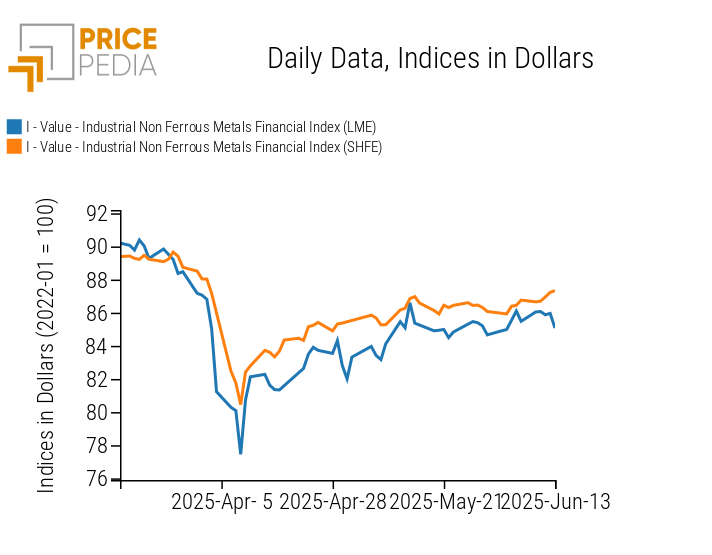
The two financial indices for non-ferrous metals show slight fluctuations, with an overall price trend that remains upward.
PricePedia Financial Indices of Non-Ferrous Industrial Metal Prices in USD
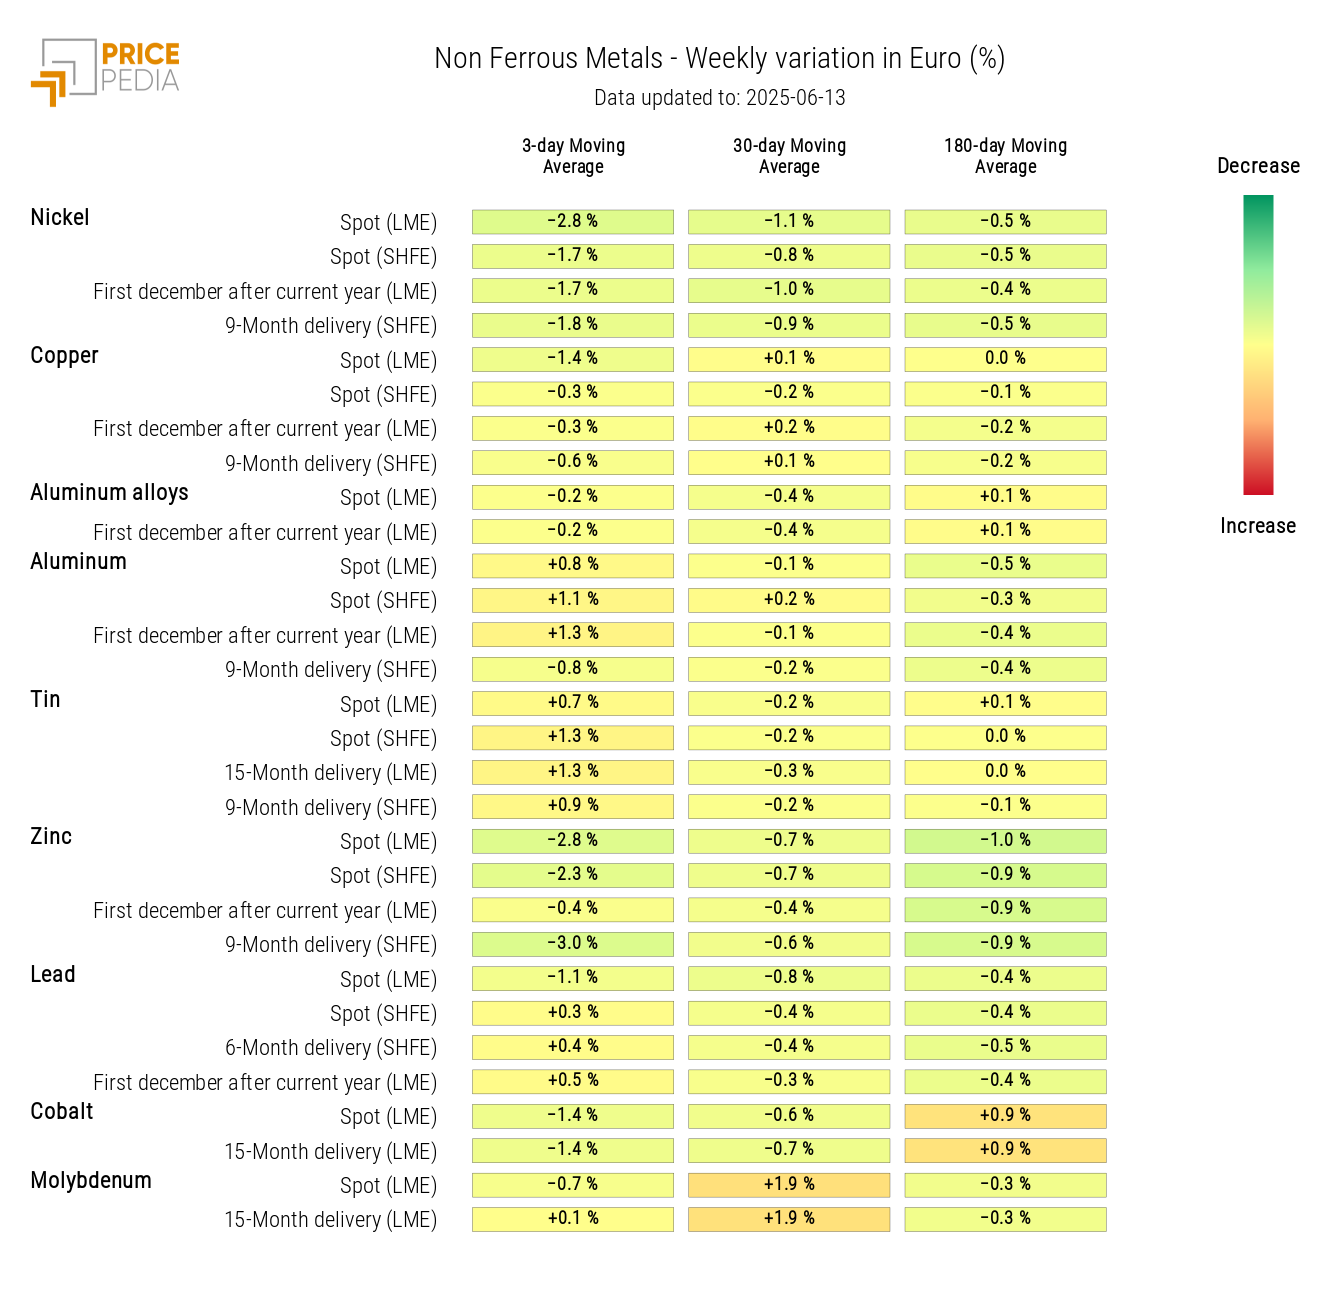
The heatmap for non-ferrous metals highlights price declines for nickel and zinc. Prices for aluminum and tin show modest increases in Euroos, which become more pronounced in USD.
HeatMap of Non-Ferrous Metal Prices in Euro
FOOD
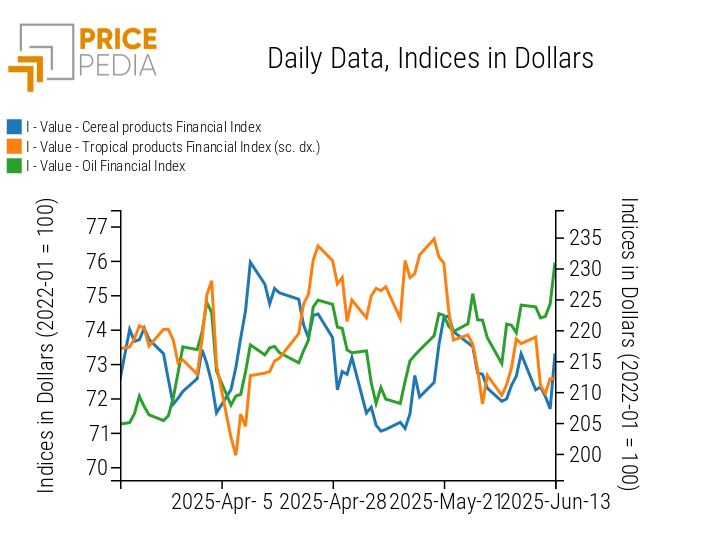
The financial index for edible oils continues its upward trend, while the indices for cereals and tropical products show fluctuations at levels that remain largely stable.
PricePedia Financial Indices of Food Commodity Prices in USD
CEREALS
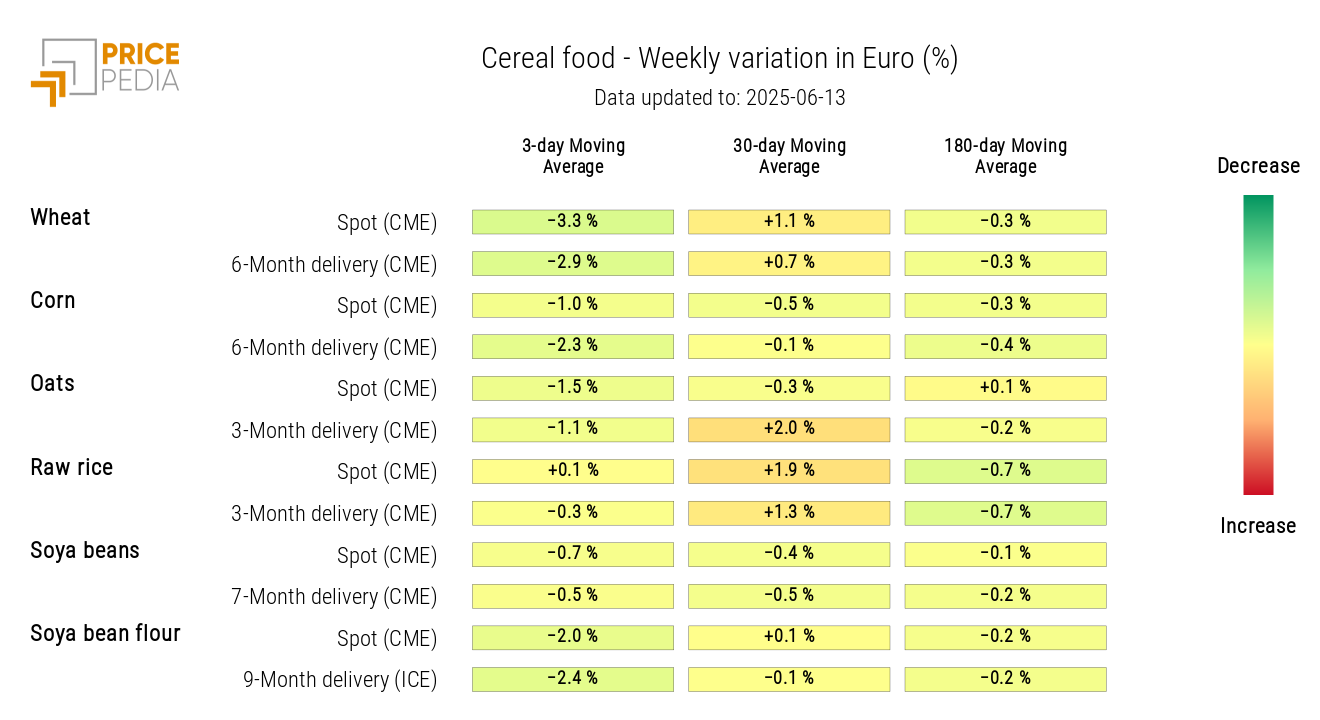
The cereal heatmap indicates a general decline in prices, more pronounced for wheat.
HeatMap of Cereal Prices in Euro
TROPICAL PRODUCTS
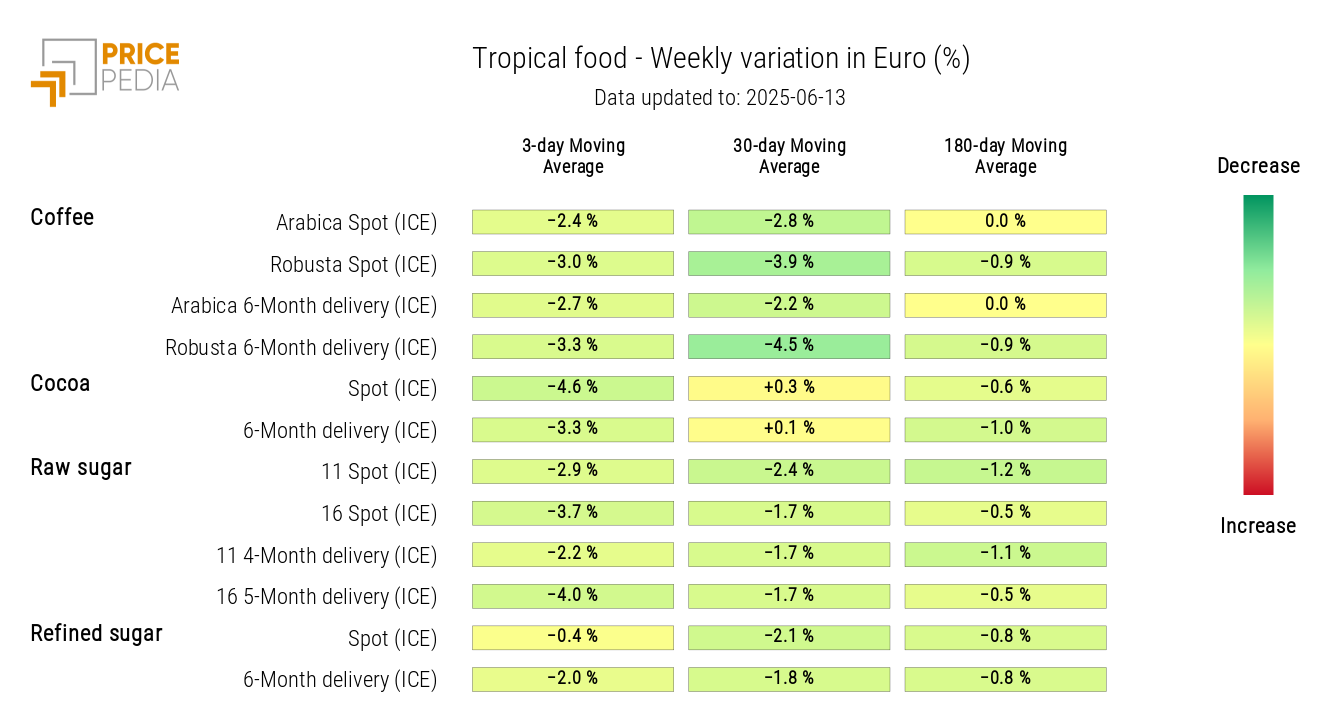
The tropical product heatmap is shaded green, indicating a drop in prices.
HeatMap of Tropical Food Commodity Prices in Euro
OILS
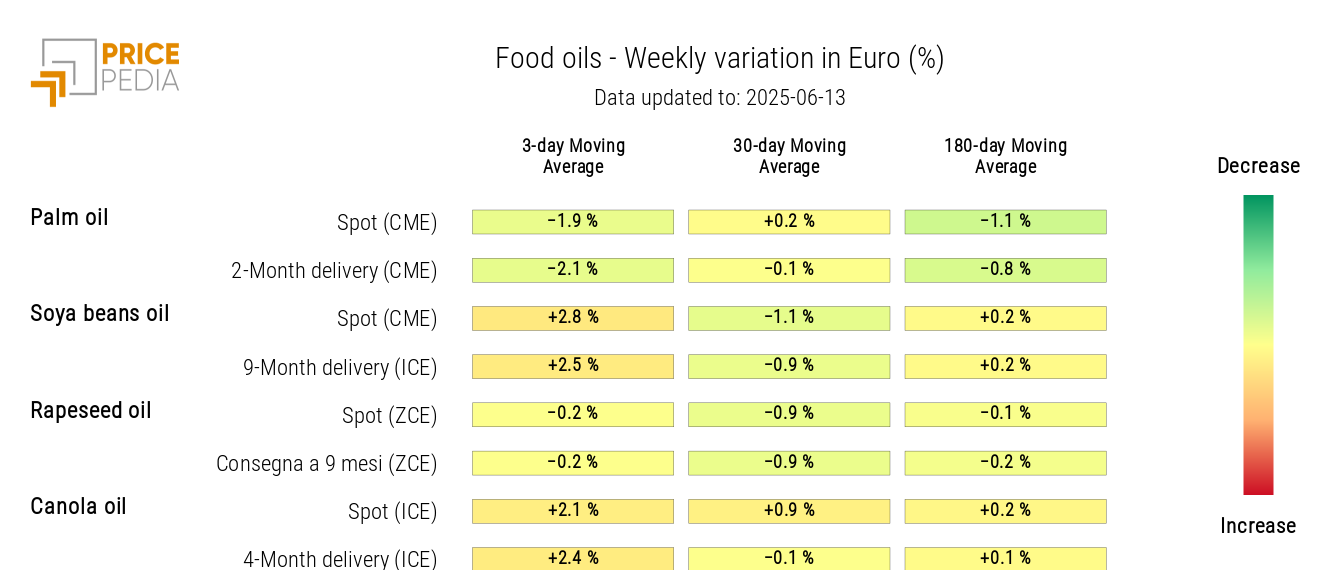
The tropical heatmap reveals a slight decrease in palm oil prices, alongside a modest increase in canola oil and soybean oil prices.
HeatMap of Edible Oil Prices in Euro
