Commodities: sailing by sight
Molybdenum market fears: will China block exports?
Published by Luca Sazzini. .
Conjunctural Indicators Commodities Financial Week
Financial markets are gradually becoming immune to Donald Trump's statements, showing increasingly muted and shorter-lived reactions. However, at least in the short term, ongoing trade tensions continue to increase volatility, triggering temporary price shocks. This was the case this week, when the announcement of a doubling of U.S. tariffs on steel and aluminum heightened turbulence in financial markets. The tariffs on steel and aluminum imports into the United States have in fact increased from 25% to 50%, with the exception of imports from the United Kingdom, which remain at 25% due to the U.S.-UK Economic Prosperity Deal, signed on May 8.
This increase in protectionist measures, announced while the United States is still negotiating with China and Europe, has fueled fears of a further escalation in trade tensions due to potential retaliatory measures by other trade partners.
In this context, the risks of an economic slowdown are also increasing, both in the United States and globally. This further complicates the decisions of the Federal Reserve (FED), which may be forced to accelerate the adoption of expansionary monetary policies to support the U.S. economy, despite inflation remaining above target.
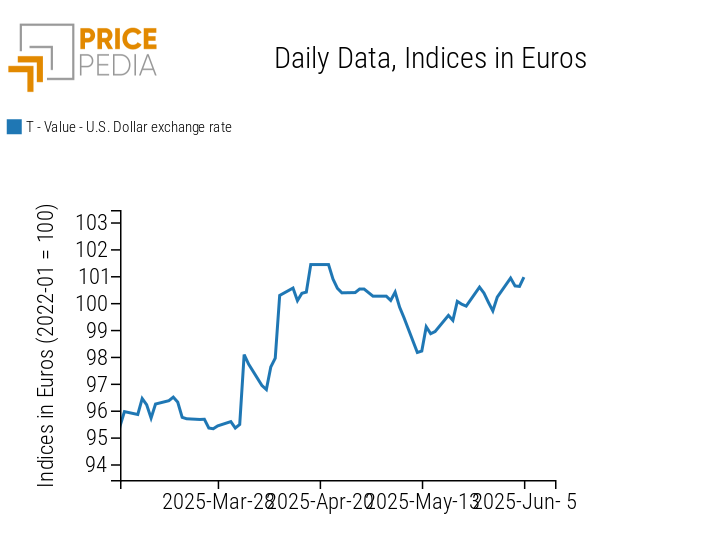
The persistence of inflation above the FED’s target, combined with expectations of an earlier rate cut, contributed to the depreciation of the U.S. dollar at the beginning of the week.
The chart below shows the trend of the exchange rate between the euro and the U.S. dollar.
Exchange rate between the euro and the U.S. dollar
Weekly summary of financial commodity prices
Following last week's price slowdown, caused by the downward revision of China's economic growth outlook, commodity prices have seen some increases, supported by the depreciation of the dollar and various short-term shocks.
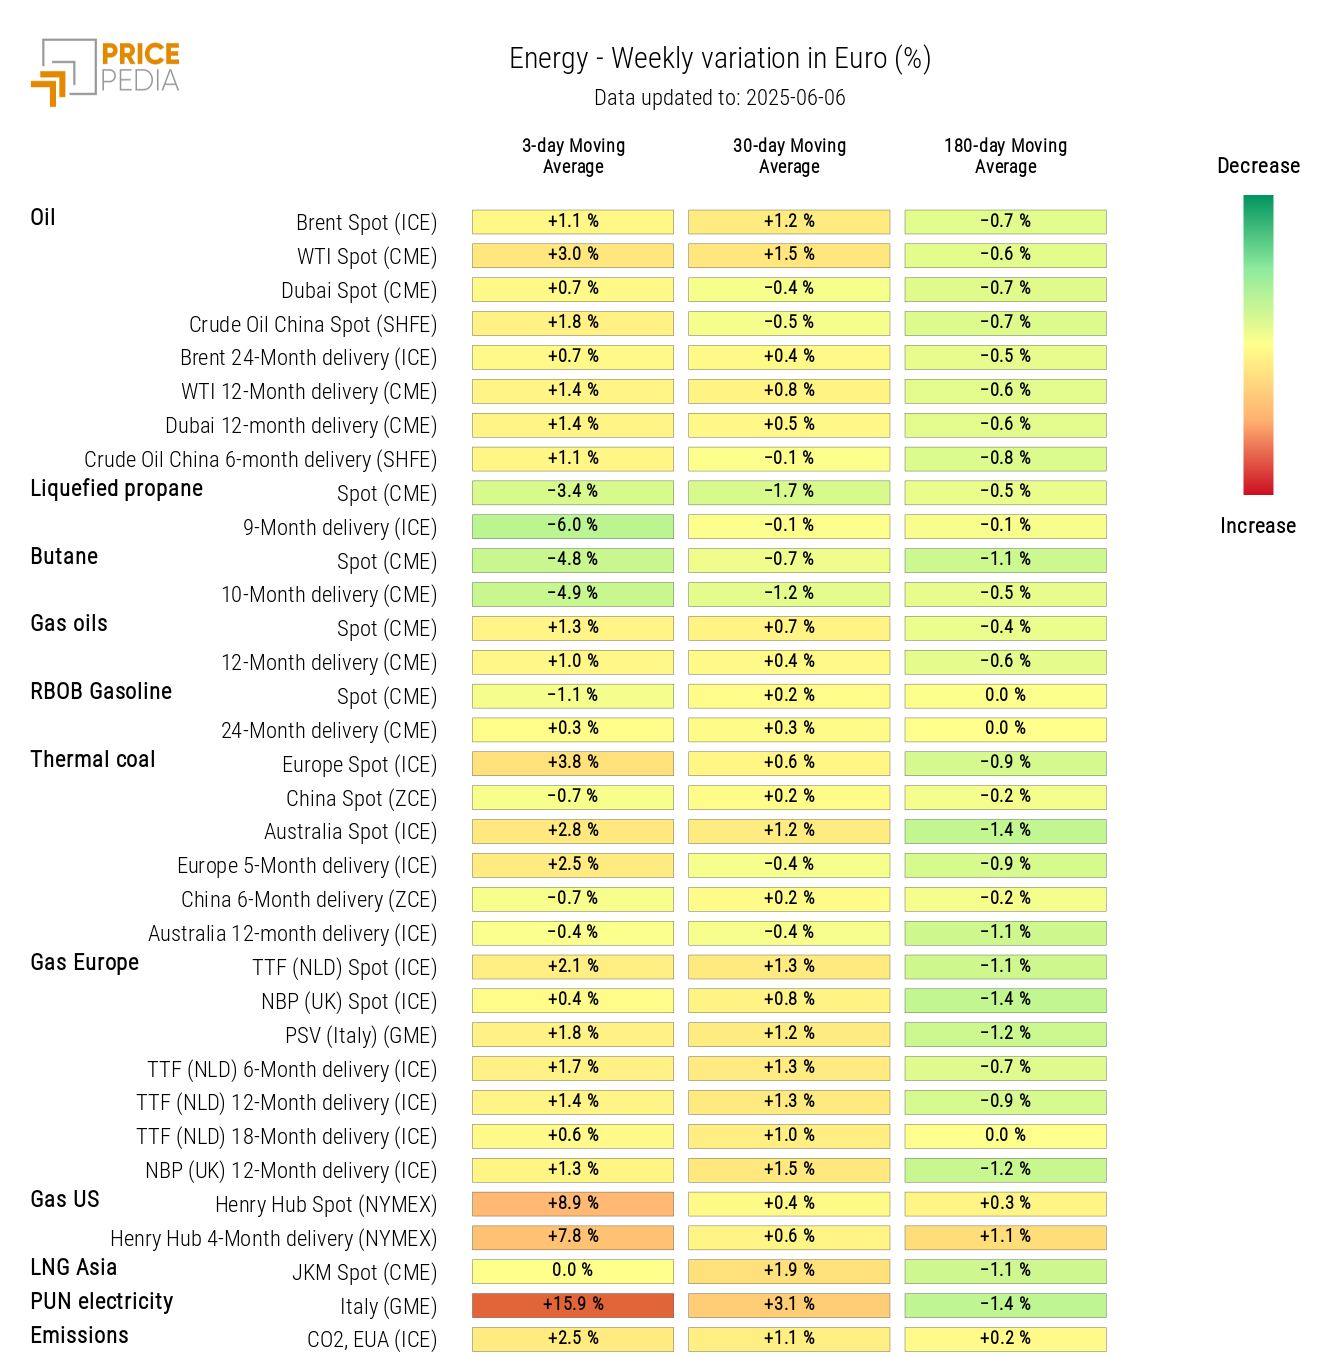
The energy sector saw significant increases, driven by developments in oil and natural gas prices.
The price of oil rose mainly due to wildfires in Alberta, Canada, which halted part of oil production, and because of lower-than-expected supply increases from OPEC.
TTF natural gas (Netherlands) experienced an even sharper rise, driven by adverse weather conditions, maintenance shutdowns in Norway, and especially by the escalation of the Russia-Ukraine conflict following a Ukrainian attack on Russia, which increased geopolitical tensions and uncertainty over energy supplies.
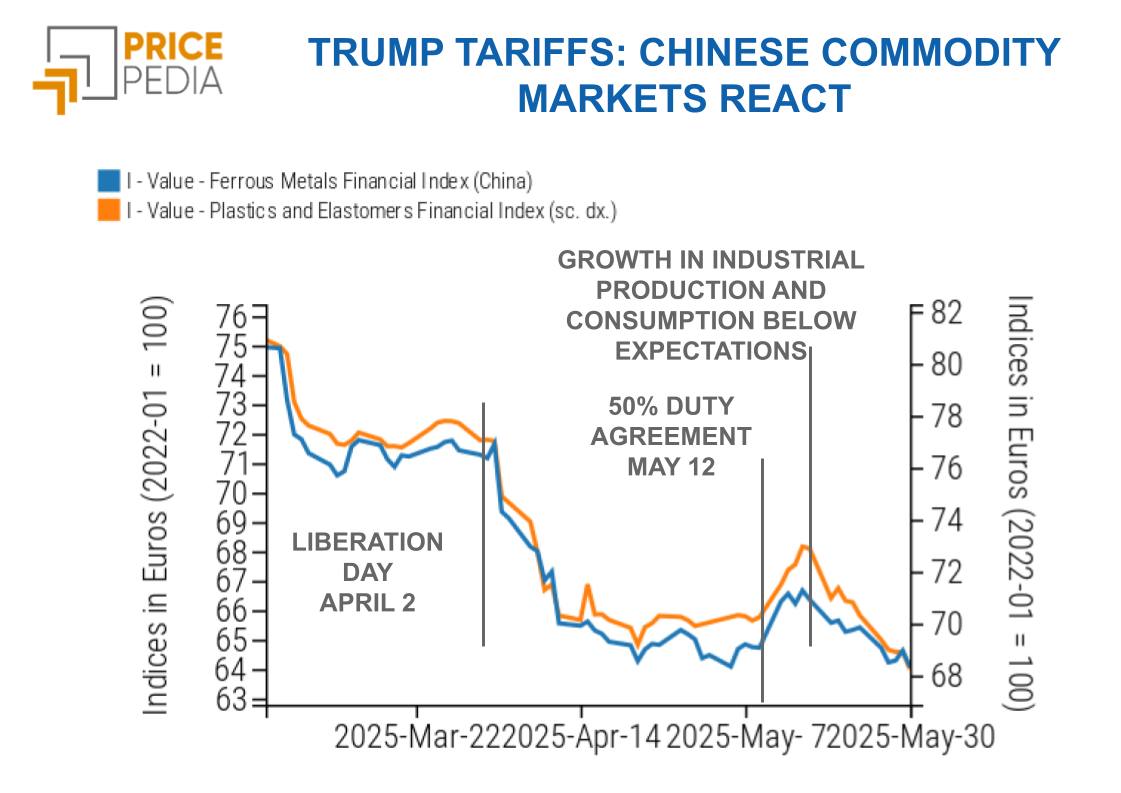
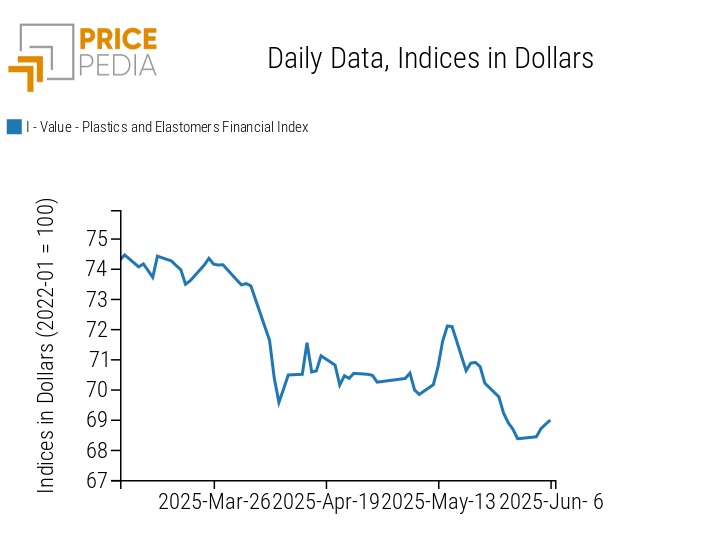
Chinese financial prices for plastics and elastomers halted their previous decline and began to recover slightly.
Safe-haven assets such as gold and silver rose, particularly at the beginning of the week, in response to the new U.S. tariffs and the intensification of the Russia-Ukraine conflict, which appears far from any peace negotiations.
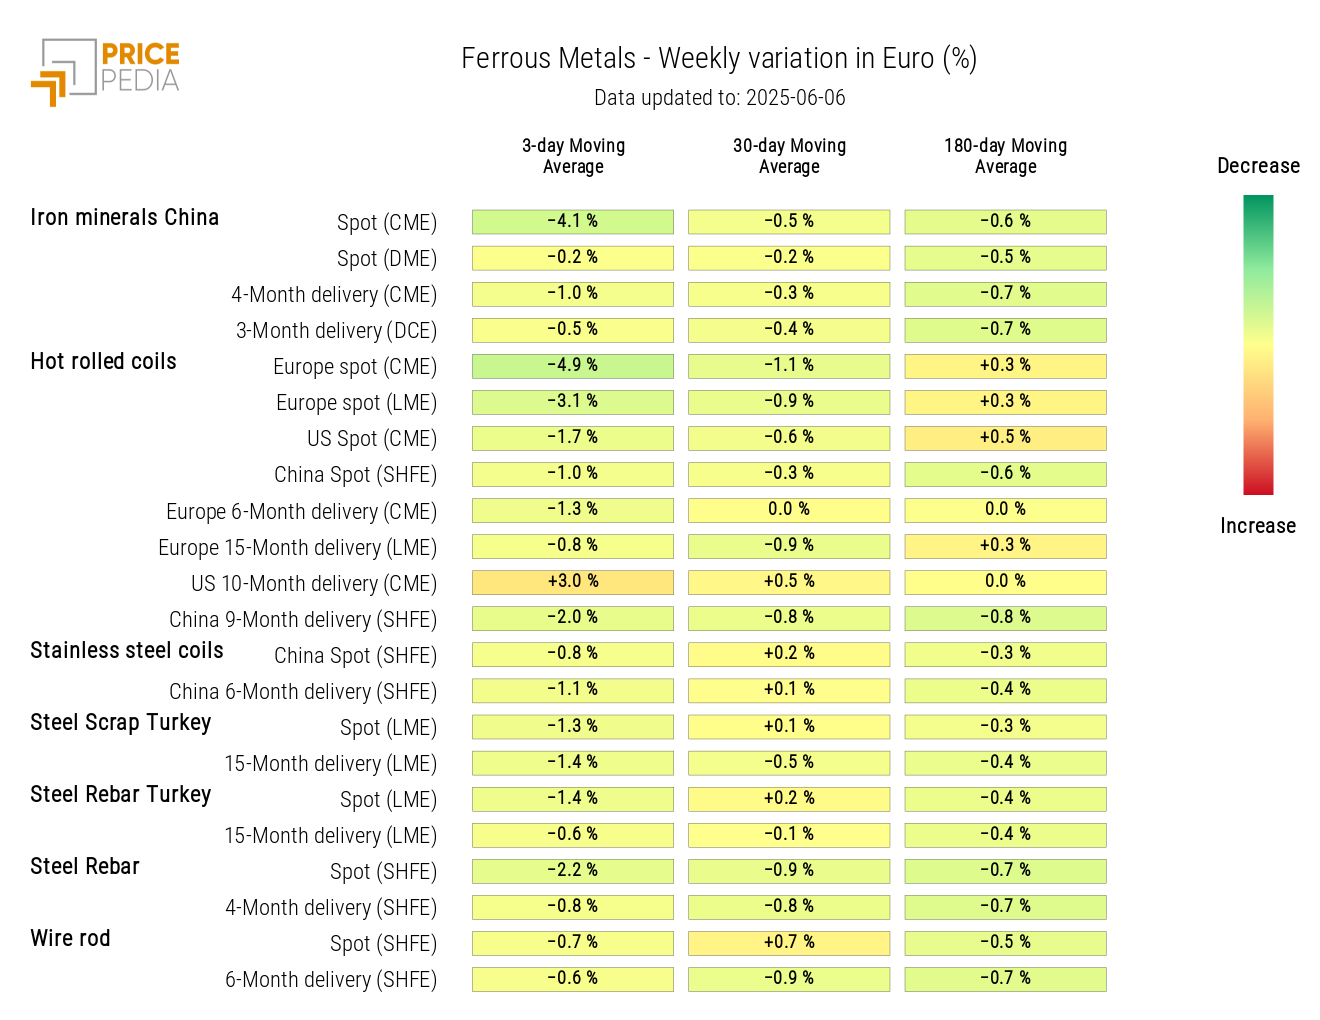
Among industrial metals, sector trends were mixed. In the ferrous metals segment, Chinese prices for iron ore and European prices for hot rolled coils dropped sharply, mainly due to the doubling of U.S. steel tariffs. In the non-ferrous market, price movements were more moderate with slight overall increases. Financial prices for aluminum remained largely stable following the U.S. tariff announcement, while prices for the Midwest U.S. aluminum premium, delivered duty-unpaid (source: Platts), rose by nearly $150/ton compared to Friday, May 30 prices, marking an increase of about 17%.
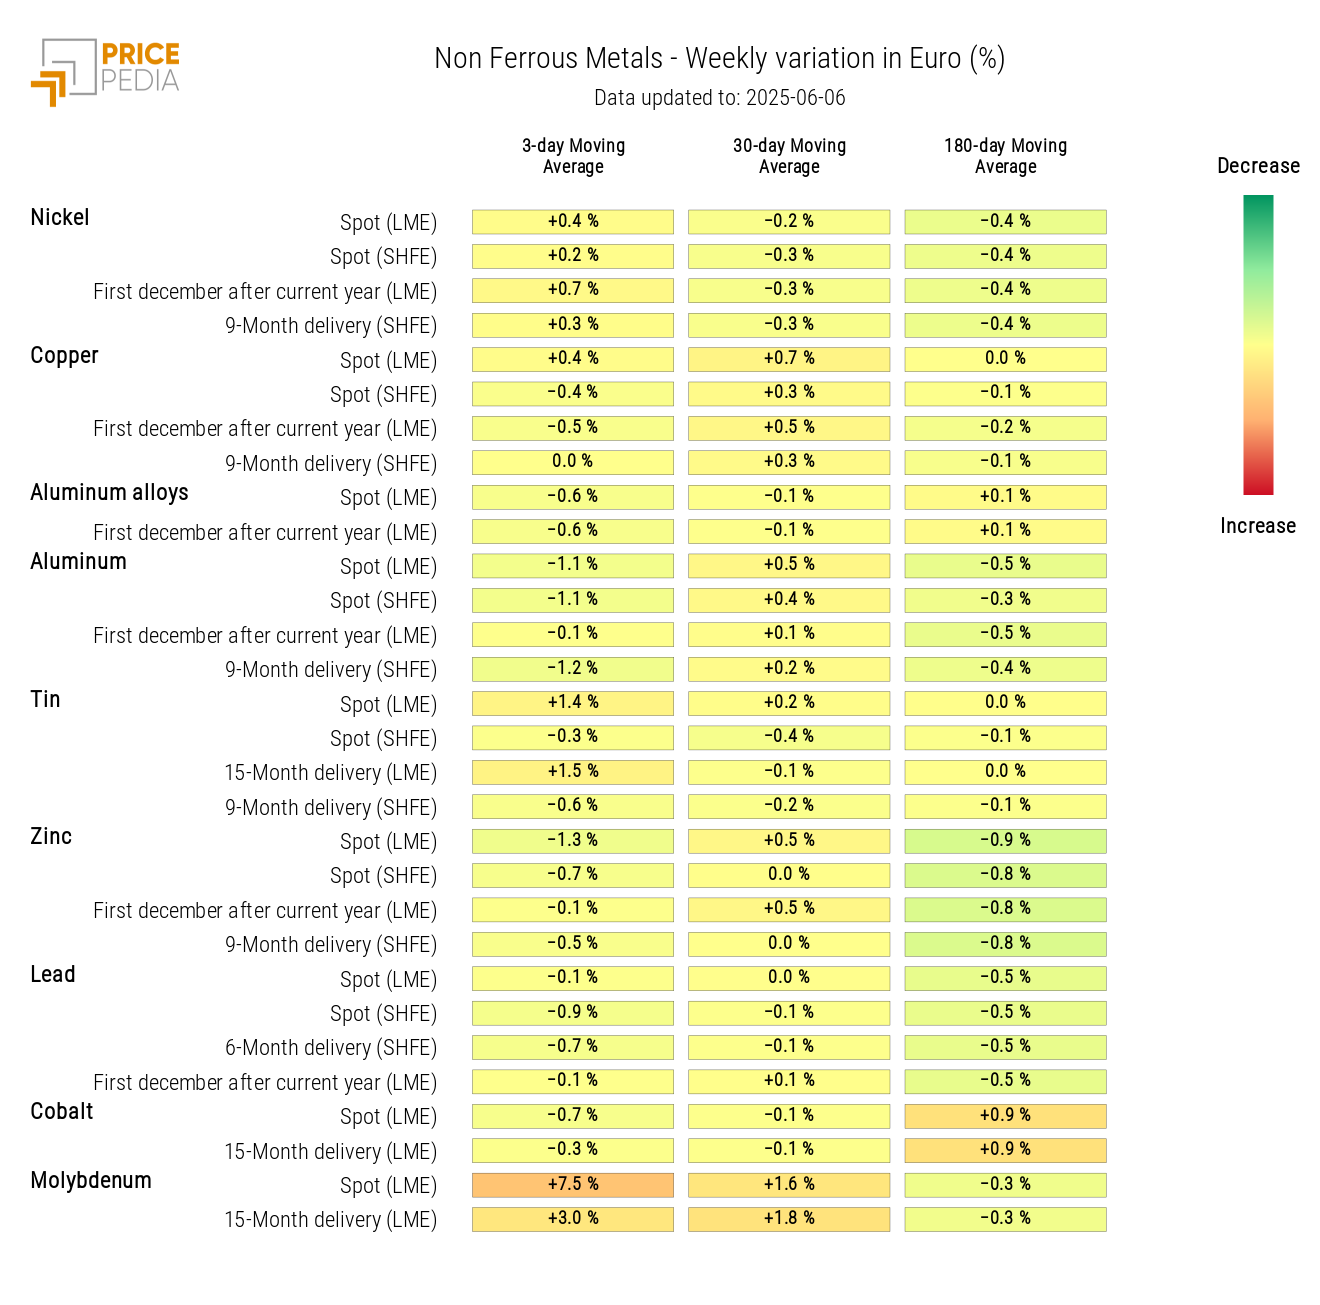
Among non-ferrous metals, the price that saw the sharpest rise was molybdenum, fueled by fears of a potential tightening of Chinese export restrictions to the United States. China had already imposed restrictions on the export of certain rare metals, including molybdenum, as a retaliatory measure against U.S. tariffs. The further escalation in trade tensions has reignited concerns over new supply limitations.
ECB Monetary Policy
At its June 5 meeting, the European Central Bank (ECB) cut the deposit rate to 2%, in line with analysts’ expectations. More surprising, however, was the downward revision of inflation forecasts, projected to reach 2% by the end of 2025 and 1.6% in 2026.
Future monetary policy moves will also depend on developments in the trade war with the United States, with President Lagarde reiterating that there is no pre-set path.
Financial markets are pricing in another rate cut between September and December, although an earlier move in July remains possible if talks with Washington significantly deteriorate.
NUMERICAL APPENDIX
ENERGY
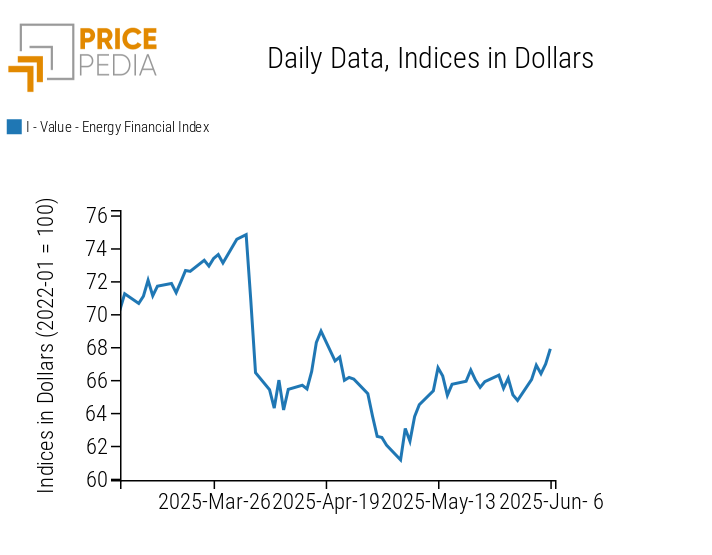
The PricePedia energy index returns to an upward trend.
PricePedia Financial Index of Dollar Energy Prices
The energy heatmap shows an increase in oil and natural gas prices, while prices for liquefied propane and butane declined.
HeatMap of energy prices in euros
PLASTICS
The Chinese financial index for plastics and elastomers has halted its downward trend, showing an upward movement toward the end of the week.
PricePedia Financial Indices of Dollar Prices for Plastics
FERROUS METALS
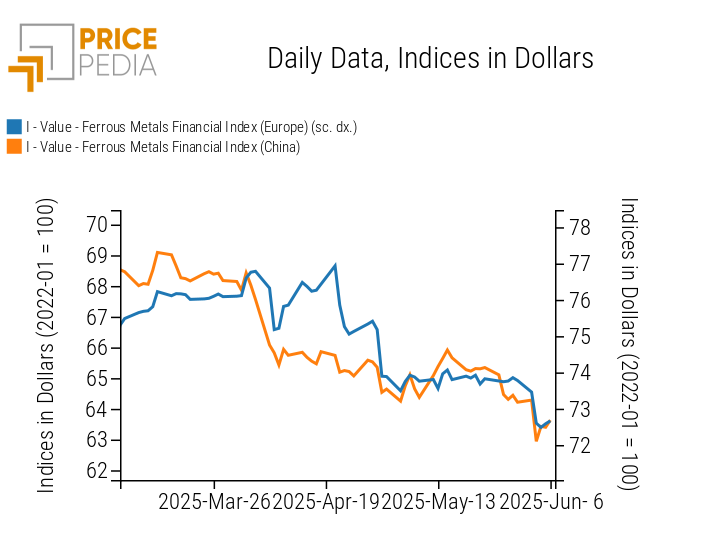
Both indices for ferrous metals recorded a sharp decline on Tuesday, following Trump’s signing of the executive order imposing a 50% tariff on steel and the release of weak Chinese Caixin PMI data.
PricePedia Financial Indices of Dollar Prices for Ferrous Metals
The analysis of the heatmap highlights the decline in Chinese iron ore prices and in European hot-rolled coil prices.
HeatMap of ferrous prices in euros
Do you want to stay up-to-date on commodity market trends?
Sign up for PricePedia newsletter: it's free!
INDUSTRIAL NON-FERROUS METALS
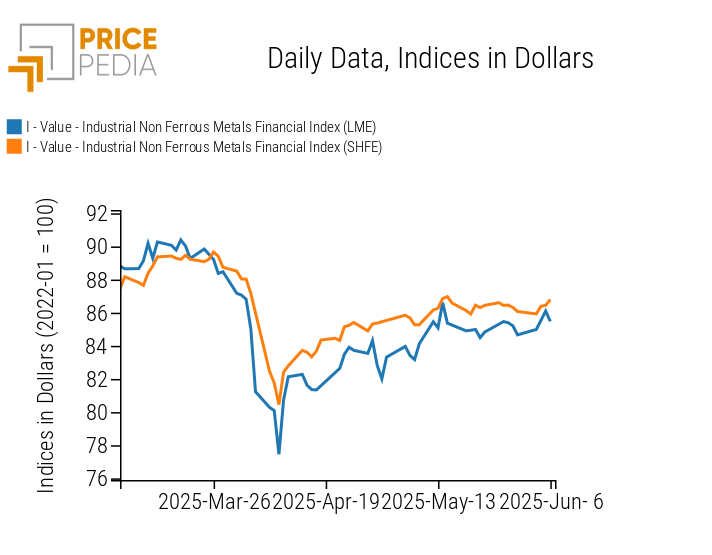
The two financial indices of non-ferrous metals remain relatively stable, showing slight price increases.
PricePedia Financial Indices of non-ferrous industrial metal prices in dollars
The non-ferrous heatmap shows a weekly increase in molybdenum prices.
HeatMap of non-ferrous prices in euros
FOOD
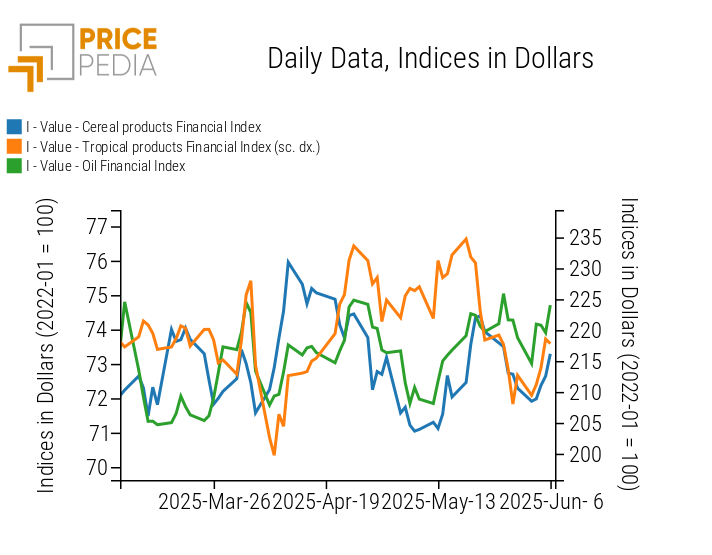
The financial indices of cereals, tropicals, and oils, after a drop on Monday, recorded a price rebound.
PricePedia Financial Indices of food prices in dollars
TROPICALS
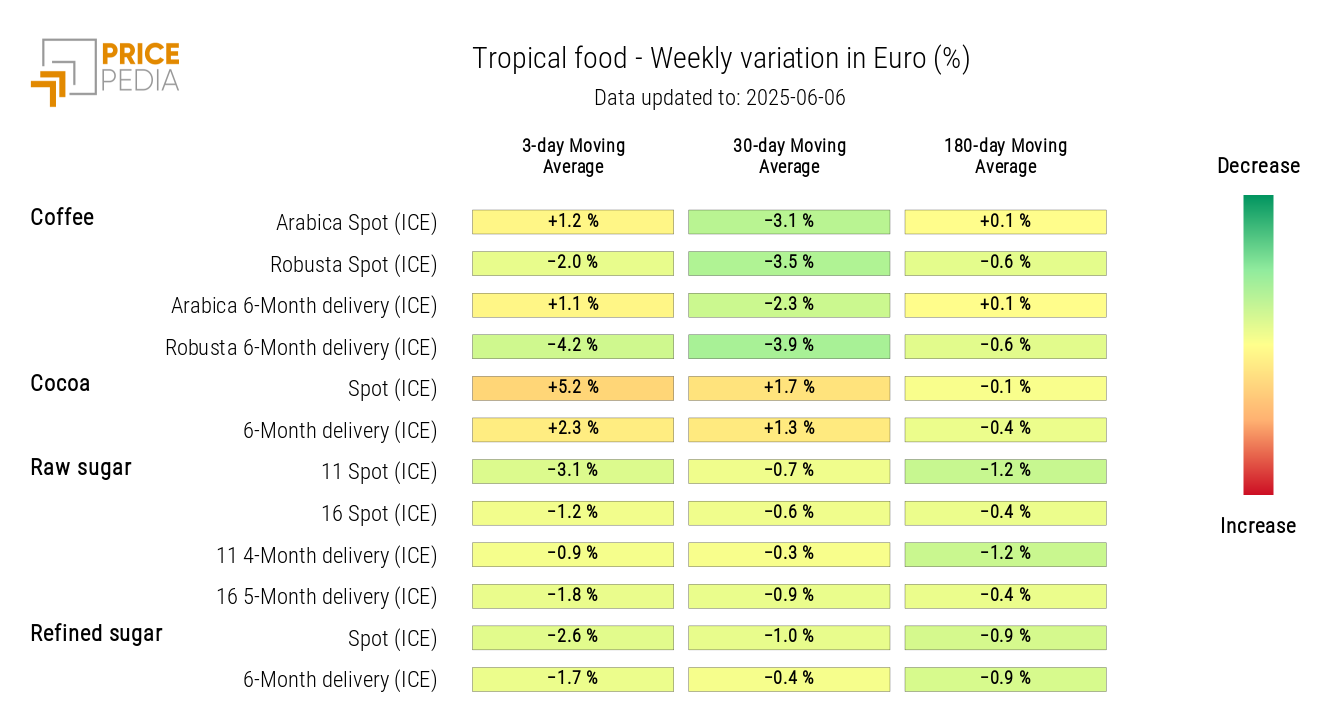
The tropical heatmap shows a weekly increase in the 3-day moving average of cocoa prices, alongside a decrease in sugar prices.
HeatMap of tropical food prices in euros
OILS
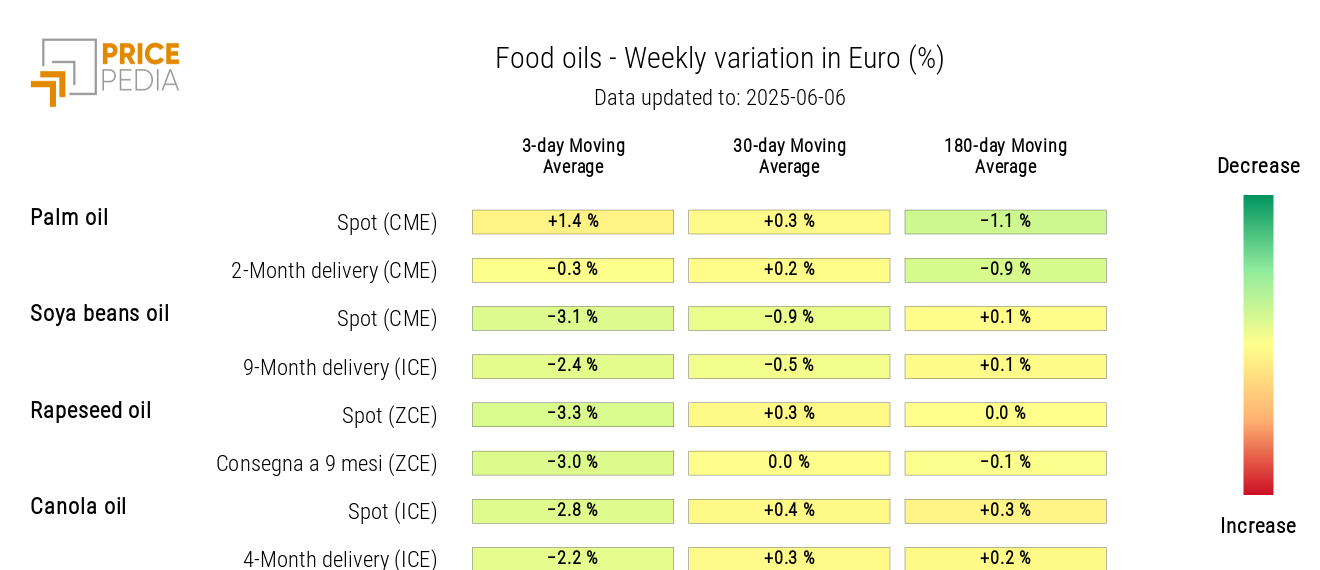
The heatmap shows a weekly decline in oil prices, with the exception of palm oil prices.
HeatMap of edible oil prices in euros
